Article Text

Abstract
Objective To develop and validate the WHALES screening tool predicting short-term mortality (3 months) in older patients hospitalised in an acute geriatric unit.
Methods Older patients transferred to an acute geriatric ward from June 2017 to December 2018 were included. The cohort was divided into two groups: derivation (n=664) and validation (n=332) cohorts. Cause for admission in emergency room, hospitalisation history within the previous year, ongoing medical conditions, cognitive impairment, frailty status, living conditions, presence of proteinuria on a urine strip or urine albumin-to-creatinine ratio and abnormalities on an ECG were collected at baseline. Multiple logistic regressions were performed to identify independent variables associated with mortality at 3 months in the derivation cohort. The prediction score was then validated in the validation cohort.
Results Five independent variables available from medical history and clinical data were strongly predictive of short-term mortality in older adults including age, sex, living in a nursing home, unintentional weight loss and self-reported exhaustion. The screening tool was discriminative (C-statistic=0.74 (95% CI: 0.67 to 0.82)) and had a good fit (Hosmer-Lemeshow goodness-of-fit test (X2 (3)=0.55, p=0.908)). The area under the curve value for the final model was 0.74 (95% CI: 0.67 to 0.82).
Conclusions and implications The WHALES screening tool is a short and rapid tool predicting 3-month mortality among hospitalised older patients. Early identification of end of life may help appropriate timing and implementation of palliative care.
- chronic conditions
- clinical decisions
- end-of-life care
- hospital care
- supportive care
- terminal care
Data availability statement
Data are available upon reasonable request.
This is an open access article distributed in accordance with the Creative Commons Attribution Non Commercial (CC BY-NC 4.0) license, which permits others to distribute, remix, adapt, build upon this work non-commercially, and license their derivative works on different terms, provided the original work is properly cited, appropriate credit is given, any changes made indicated, and the use is non-commercial. See: http://creativecommons.org/licenses/by-nc/4.0/.
Statistics from Altmetric.com
Key messages
What was already known?
Identifying end of patient’s life by caregivers is difficult.
Palliative care is vital in end of life for goal-concordant outcomes.
What are the new findings?
Short-term mortality scoring allows caregivers to apply more timely palliative care.
The WHALES score accurately predicts short-term mortality in hospitalised older patients.
What is their significance?
Clinical: It is an easy and rapid routine use screening tool at hospital admission.
Research: Expands the use of a short-term mortality score on different segments of a population.
Introduction
Global population ageing increases the prevalence of chronic diseases. Approximately 80% of older adults have a chronic disease.1 The leading ones being heart disease, cancer, stroke, dementia and diabetes.2 Consequences of these conditions include impacts on health, quality of life and healthcare. Natural progression of chronic diseases leads to higher burden of care and multiple hospitalisations.3 It is reported in the UK that one-third of patients aged above 75 years old are hospitalised in a year.4
These unplanned hospitalisations often deal with acute problems and do not allow an assessment of patients in their globality often leaving aside patients’ goals of care and values.5–8 This phenomenon increases when nearing patients’ end of life. Houttekier et al show that among patients with dementia living in nursing homes, in the month prior to their death, 19.5% are hospitalised including 4.6% admitted in intensive care units (ICUs).9 DiGiulio et al10 report in a same population set that 48 hours prior to patients’ death, 20.5% were on artificial feeding, 66.6% on fluids by infusion and 71.6% on antibiotics; treatments which may be considered inappropriate in end-of-life care. Numerous studies underline the difficulties that healthcare professionals have to identify and treat certain life-threatening diseases, such as dementia, terminal heart failure or respiratory failure, as these diseases require palliative care and thus, a discussion with patients and families.11–13 The uncertainty of the time of the next decompensation and impending death causes doubts on goal of care. This lack of awareness and certain misconceptions on palliative care leads to insufficient access to palliative care. Gavazzi et al reported over 40 days of hospitalisation prior to death in chronic respiratory diseases.14 Better knowledge of indicators of short-term poor prognosis would help initiate discussions regarding pre-emptive care planning. Assessment of patients’ values and goals for therapies and outcomes in cases of exacerbation would help limit inappropriate or non-beneficial care and excessive hospital readmissions in the last days of life.
Numerous prognostic indices in older patients from medium-term (6 months) to long-term (1 year) mortality have been developed to improve identification of patients who would benefit from palliative care.15–21 These indices often include age, patient’s autonomy, frailty status, medical history, previous hospitalisations and ICU admissions22–24 and were developed predominantly on younger patients from intensive care and oncology units.
Hospital readmissions for acute exacerbation seem to be an appropriate time to discuss patients’ changing of treatment goals into comfort care. Predicting patients’ end of life as early as emergency department (ED) visits may assist clinicians in adapting patient’s care, clarify treatment goals and limit certain treatments when unwanted by patients.25 As such, there is an increasing need to develop indices which predict short-term mortality; early identification would facilitate a more rapid implementation of palliative care.26 Among these indices, the Criteria for Screening and Triaging to Appropriate aLternative care (CriSTAL tool) was developed to identify short-term risk of death among older patients aged above 65 years old on admission to hospital.22 The tool was designed based on 18 objective criteria available at the point of care, including the presence of advanced chronic illness, frailty status, history of hospital/ICU admission, nursing home residency status, physiological deterioration criteria, ECG and urine analysis. This tool was validated in different geriatric population sets (Australia, Denmark and Ireland).22 27 However, the overburdening of excessive criteria raises the problem of the feasibility and practicality of this tool in an acute setting.
The present study aimed to design a short and simple predictive short-term mortality (3 months) tool for older patients hospitalised in an acute geriatric ward adapted from the CriSTAL criteria. The second objective was to validate the tool’s accuracy in estimating short-term mortality risk among a wide range of patients hospitalised in a geriatric ward after an ED visit.
Methods
Study setting and participants
A prospective cohort study was conducted at the Toulouse University Hospital, France, from June 2017 to December 2018.
Patients consecutively enrolled in this study were aged above 65 years old and hospitalised in an acute geriatric ward after visit in the ED. This geriatric ward has a maximum capacity of 20 beds, and an average of 4.5 days of hospitalisation.
A written informed consent was obtained from the patient or their family, those who could not provide one or were opposed to the use of their medical data and follow-up were excluded.
Data collection
Medical data of patients were obtained from electronic medical records using a standardised data collection form and were collected within 48 hours after admission in the acute geriatric ward and at 3 months by telephone after discharge by a clinical research assistant. Patients were recruited over 9 months and overall study duration was 18 months.
As part of usual care, the information included demographic data, medical history and underlying comorbidities.
From the CriSTAL tool criteria, rapid response systems criteria for deteriorated inpatient on admission in the emergency room (ER) were not collected due to imprecise and tedious data collection in an emergency context.22
A total of eight items were understudy including:
Cause for admission in ER.
Hospitalisation history within the previous year (including intensive care admissions).
Ongoing medical conditions including: advanced malignancy, chronic kidney disease, chronic heart failure, myocardial infarction, chronic obstructive pulmonary disease, cerebrovascular disease and moderate or severe liver disease. Advanced malignancy was defined as a metastatic cancer, or cancer with a second-line therapy or more or cancer relapse. Chronic kidney disease according to patient’s medical history or defined by a renal clearance of <60 mL/min/1.73 m2 by the Modification of Diet in Renal Disease.28 29 Cerebrovascular disease was defined as either a stroke or a transient ischaemic attack (<1 year). Moderate or severe liver disease defined as chronic hepatitis, or elevated liver enzymes greater than three times than the upper limit of normal aspartate aminotransferase or alanine aminotransferase or bile duct obstruction.
Cognitive impairment: according to patient’s medical history or if the patient presented Diagnostic and Statistical Manual of Mental Disorders, 4th Edition (DSM-IV) criteria for dementia during hospitalisation with or without behaviour disturbance.
Frailty status was assessed during hospitalisation according to the Fried criteria.30 A frail patient was defined as a patient with at least two of the Fried criteria:
Unintentional weight loss (≥4.5 kg in past year).
Self-reported exhaustion.
Weakness (low grip strength for writing or handling small objects, difficulty or inability to lift heavy objects ≥4.5 kg).
Slow walking speed (walks 4.5 m in ≥7 s).
Inability for physical activity or new inability to stand.
Living conditions: private household, or long-term stay including nursing home.
Presence of proteinuria on a urine strip or urine albumin-to-creatinine ratio on a urine test.
Abnormalities on an ECG: atrial fibrillation, tachycardia, any abnormal rhythm or ≥5 ectopics/min, changes to Q or ST waves.
Outcome
The primary outcome was the accuracy of predictions of 3-month mortality after inclusion.
Patients’ survival status was obtained by telephone call to the patient’s practitioner or family or upon request to the patients’ town hall 3 months after hospitalisation. Use of mortality data was authorised by the Commission Nationale Informatique & Libertés.
Statistical analysis
Sample size
A minimum of 10 events per independent variable is recommended to ensure enough statistical power in multivariable regressions.31 32 As we planned to include a maximum of eight independent variables in the predictive model, we needed 80 events (deaths). With a 15% estimated 3-month death rate, 534 patients were required. A percentage of 25% of lost to follow-up was considered to reach a total of 668 patients for the derivation cohort which accounts for two-thirds of the study population.33 Thus, we needed to include a total of 1002 patients for the derivation and validation cohort.
Random numbers were assigned to each patient, these were then ranked and were used to split the sample into two-thirds for the derivation cohort and one-third for the validation cohort. The main characteristics of the two obtained cohorts were compared using appropriate bivariate tests.
Analysis
All analyses were performed using Stata V.2011 (Stata Statistical Software: Release 12. College Station, Texas, USA: StataCorp). Categorical variables were presented as frequencies and percentages, continuous variables as means and SDs or medians and IQR.
Categorical variables were compared using the χ2 or Fisher’s exact test when appropriate and continuous variables using Student’s t-test or Mann-Whitney test.
Model development and construction of the WHALES scoring system
Potential variables for prediction associated to death at 3 months were identified with bivariate analyses (p<0.20). Then a stepwise backward multivariable logistic regression was used to obtain the final model including independent variables with p<0.05, and an area under the receiver operating characteristic (ROC) curve was calculated.34
An integer scoring system was derived from the multiple logistic regression using the Sullivan et al method.34 Each risk factor was organised into meaningful categories (age was divided into three categories created according to tertiles of age: <85, 85–90, 90 years old and more) and a reference value was attributed to each risk factor. The base category was assigned 0 points. The points for each risk factor were calculated using the following formula: βi(Wij−WiREF)/B, where βi was the regression coefficient associated to the variable i, Wij the reference value of the category j for the variable i, WiREF the value of the base category for the variable I and B the number of regression units corresponding to 1 point. Points were rounded to the nearest integer value.
The 3-month mortality risk associated to each point total was computed using the multiple logistic regression equation.
Model validation
Internal validity of the predictive model and scoring system was tested in the validation cohort.
For each quintile of predictive probabilities, predictive probabilities were plotted against observed proportions of deaths, and the Hosmer-Lemeshow test was used to assess the differences between predicted and observed probabilities.
Results
A total of 1013 patients were recruited in an acute geriatric ward between June 2017 and December 2018. A total of 1009 patients were included and 4 were excluded (3 were under curatorship or tutorship, 1 of consent was not retrieved). The final cohort consisted of 1005 patients (9 patients were lost during follow-up). The flow chart corresponding to the sample selection used for this study is presented in figure 1.
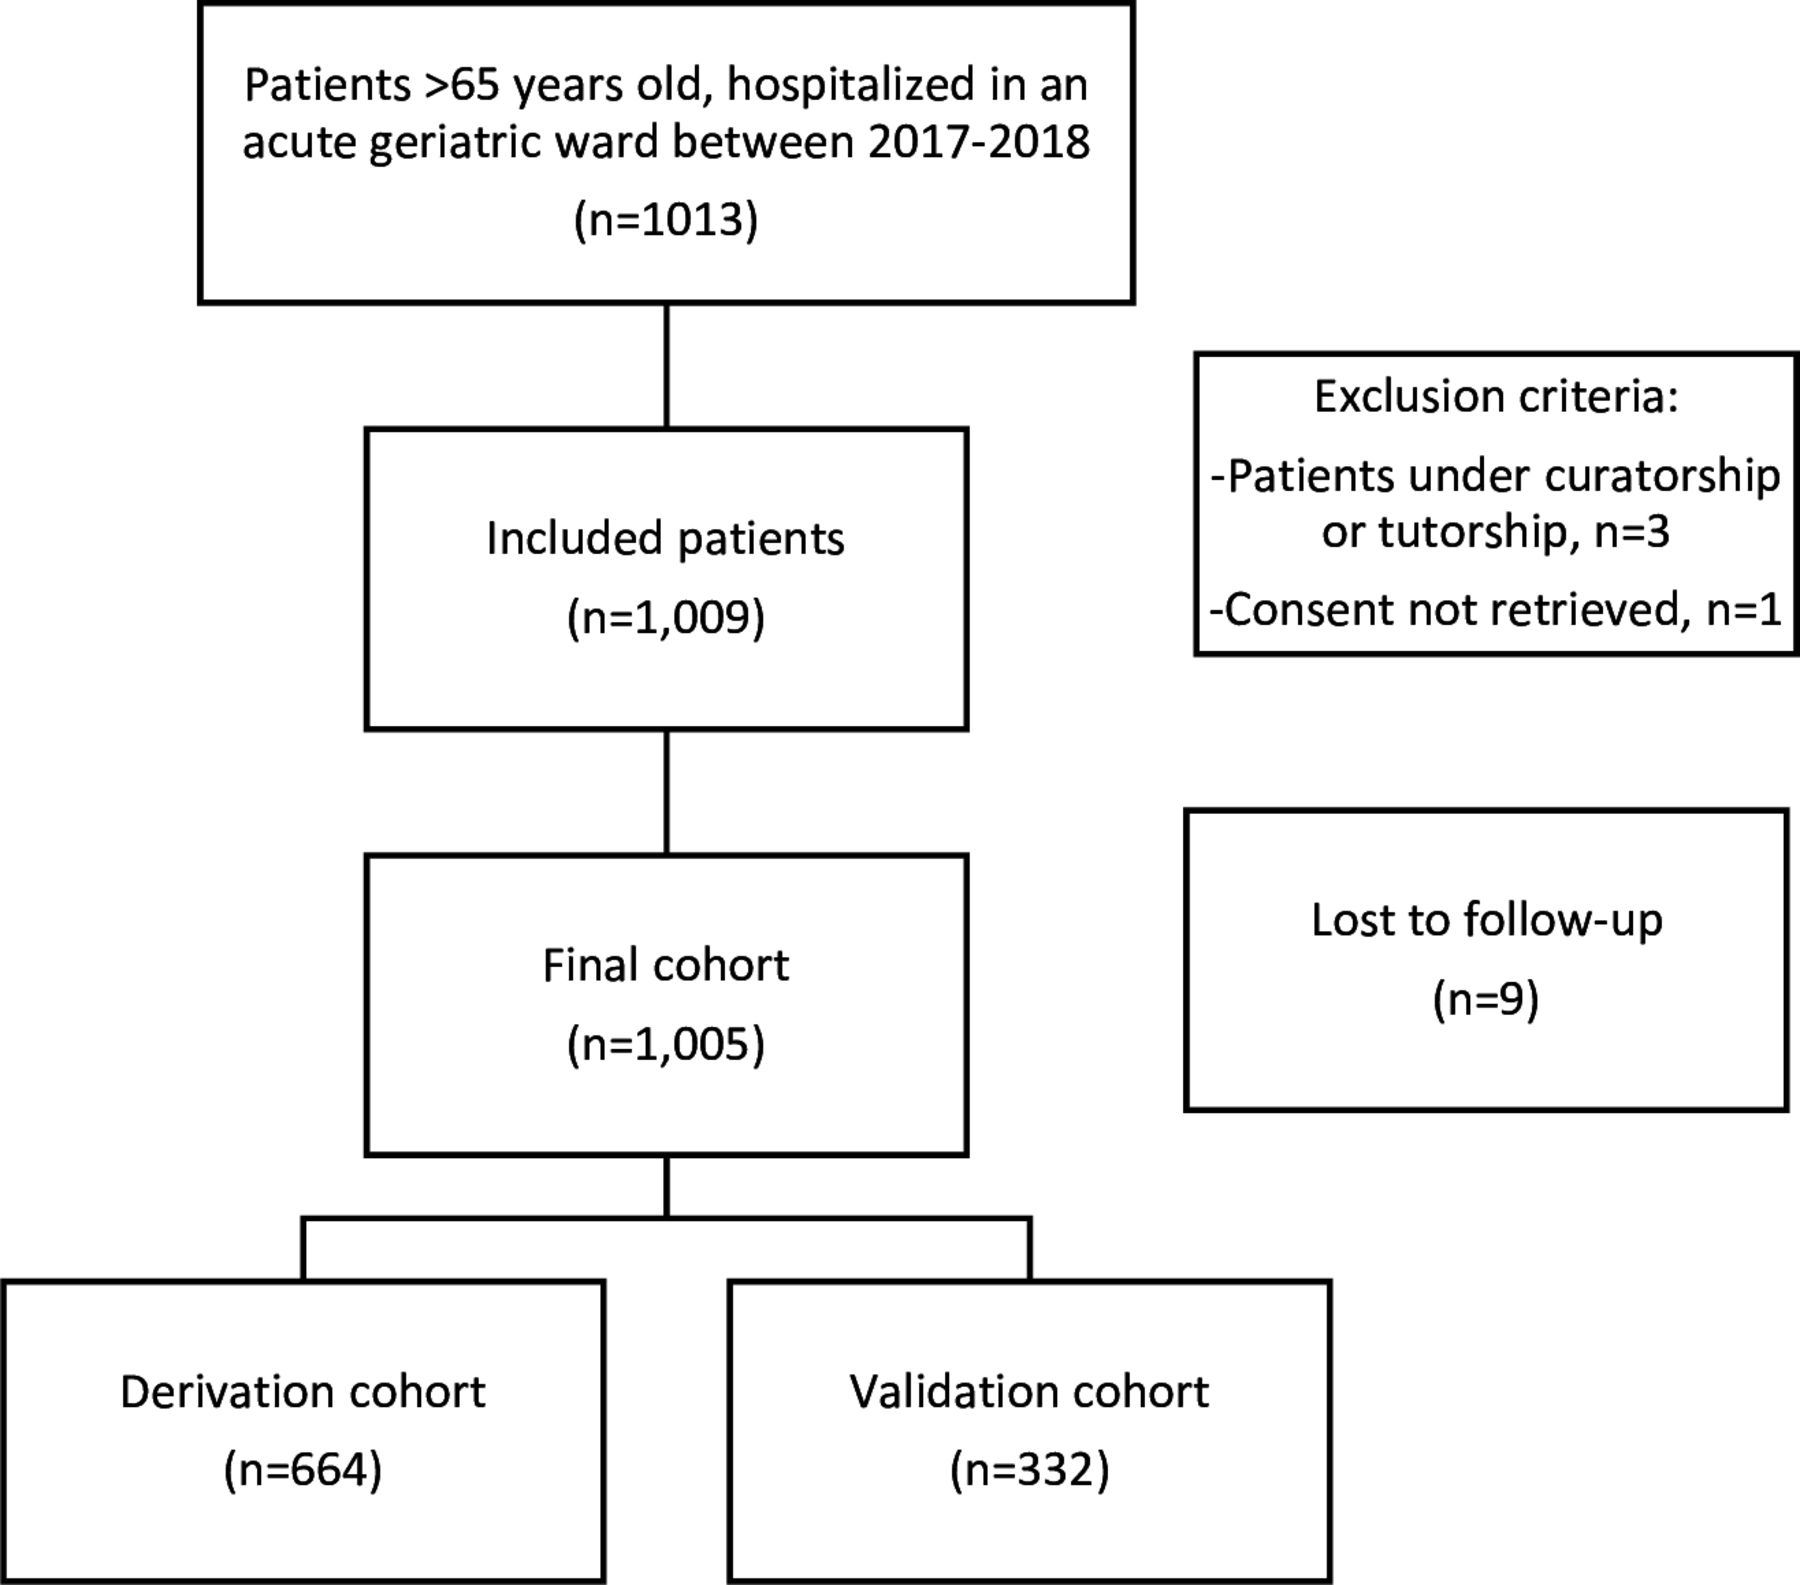
Flow chart.
Analyses of patients included and those lost during follow-up showed no statistical difference for the variables of interest (online supplemental table A1).
Supplemental material
Characteristics of study participants
Data were available for 996 patients. The mean age was 87 years, 59.1% were female and 19.2% patients lived in nursing homes. Patients’ main comorbidities were: non-advanced cancer (defined as the absence of a metastatic cancer, or cancer with a second-line therapy or more or cancer relapse) (20.1%), cognitive impairment (according to patient’s medical history or if the patient presented DSM-IV criteria for dementia during hospitalisation) (25.6%), peripheral artery disease (8.7%), chronic heart failure (23.4%) and autoimmune disease (6.3%).
The main reasons for admission in the ED were alteration of general state (29.3%), abdominal pain (23.5%), fall (21.9%) and acute heart failure (20.4%). Median length of hospital stay was of 5 days (IQR: 4–7). A total of 170 patients died at 3 months following their inclusion, with a mortality rate of 17.1%. Mean length of death was 39 days from hospitalisation (IQR: 13–66).
General characteristics of the 664 patients of the derivation cohort and the 332 patients of the validation cohort are presented in table 1.
Comparative characteristics of patients in derivation and validation cohorts
Development of the predictive model in the derivation cohort
In bivariate analyses, sex, age, nursing home residency, non-advanced cancer, chronic heart disease, chronic moderate to severe liver disease, evidence of frailty (unintentional weight loss, self-reported exhaustion, weakness, slow walking speed and inability for physical activity), abnormal ECG and heart rate were associated with 3-month mortality with p<0.20 (online supplemental table A2).
Five variables remained in the final model (p<0.05): sex, age, nursing home residency, unintentional weight loss and self-reported exhaustion (table 2). The Hosmer-Lemeshow test was not significant (p=0908). Thus, there was no significant difference between the prediction by the risk model and what was actually observed (online supplemental figure A1).
Multivariate analysis of predictive risk factors of short-term mortality
The area under the curve (AUC) value for the final model was 0.74 (95% CI: 0.67 to 0.82) (online supplemental figure A2).
The mortality risk at 3 months based on the logistic model is:

Construction of the prognostic score
Based on the five independent prognostic factors selected with the logistic regression analysis, we established a scoring system presented in table 3.
Short-term mortality scoring system
The overall score ranged from 0 to 25.
Table 4 presents the short-term mortality risk for each possible overall score. For example, an 82-year-old man, who does not live in a nursing home, who did not lose any weight but who is exhausted, will have an overall score of 11 and an estimated mortality at 3 months of 11.1%.
Mortality risk estimation based on overall score
The performance of the risk score is shown in the ROC curve (online supplemental figure A3), with an AUC of 0.73 (95% CI: 0.66 to 0.81).
With a maximal acceptable false positive rate at 5%, the score’s cut-off is 17, with a sensitivity of 21% and a specificity of 97%. With this cut-off score, we obtained a positive predictive value of 48% and a negative predictive value of 90%. It indicates that almost 50% of people with a positive screening will die in the following 3 months and that 90% of the people with a negative screening will not die (online supplemental table A3).
In the derivation sample, 46% (17 of 37) of patients above this cut-off died vs 11.3% (54 of 477) of patients with a total score below this cut-off. In the validation sample, there are 35% (7 of 20) and 10.9% (25 of 226) of deaths, respectively, in patients with a total of points above and below this cut-off.
Validation of the risk score
Overall, 335 patients were included in the validation group. Baseline characteristics were similar in both groups derivation and validation with the exception of chronic heart failure as reported in table 1.
There was no significant difference between the proportion of observed and predicted deaths in the validation group with a Hosmer-Lemeshow p=0.179. Online supplemental figure A4 compares the proportion of observed and predicted deaths in our mortality prediction score.
The performance of the risk score in identifying patients at risk of mortality in 3 months in the validation group is shown in the ROC curve in figure 2, with AUC=0.71 (95% CI 0.61 to 0.81). This indicates that the risk model has performed well in the validation cohort.

Comparison of AUCs for prediction of short-term mortality. AUC, area under the curve; CriSTAL, Criteria for Screening and Triaging to Appropriate aLternative care.
Comparison of the WHALES criteria with the CriSTAL mortality screening tool
The AUCs of the different mortality risk scores were then compared, there was no significant difference between the AUC of the WHALES criteria 0.69 (95% CI: 0.60 to 0.78) and the CriSTAL score 0.71 (95% CI: 0.62 to 0.81) with p=0.665 (figure 2).
Discussion
Main results
In this study, we developed the WHALES tool, a shorter and more simple predictive short-term mortality tool based on the CriSTAL screening tool. This tool aims to predict short-term mortality in older patients hospitalised after an emergency admission. Five independent variables among the CriSTAL criteria were available from medical history and clinical data and strongly predictive of short-term mortality in older adults. Those selected were age, sex, living in a nursing home, unintentional weight loss and self-reported exhaustion. The word WHALES is an acronym for the five variables predictive of short-term mortality: weight, age, living location, exhaustion and sex.
The calibration and the prediction scores’ AUC ranging from 0.61 to 0.81 were good; no significant difference was found with the CriSTAL score AUC of 0.71 (95% CI: 0.61 to 0.81) with p=0.679 in this population set. We found that a threshold score of 17 identified a group of patients with a high likelihood of 3-month mortality with a reasonable specificity and sensitivity.
This work offers an easy short-term mortality predictive tool for ED clinicians to consult when dealing with older patients, a population set often difficult and complex to assess comprehensively. Very few prediction models have a high discriminatory ability and clinical utility in this population set.26 35 36
It is well acknowledged that predicting prognosis in older patients is important when discussing benefits and burdens of tests and treatments, as it limits arbitrary age-based cut-offs in health decision-making.26 Numerous studies have developed mortality prognostic tools on older patients in various settings: community-dwelling population, nursing home residents or hospitalised patients. A majority of those measured mortality risk on a longer time period, with a few that focused on predicting post-hospital mortality on a period of time 3–6 months.26 35–37 As 1-year mortality prediction may help when discussing continuation of certain treatments and complementary examinations, short-term mortality prediction is as important. Indeed, it may help identify and alert likelihood of imminent death to healthcare professionals for rapid implementation of palliative care.26 38
Among these indices, McCusker et al elaborated the Identification of Seniors At Risk (ISAR) score based on six simple dichotomous questions, predicting 3-month mortality. AUC predictive ability was good in the original Canadian population (AUC=0.71).39 However, tested in different population sets, the ISAR was poor at predicting adverse outcomes (AUC: 0.60) making it unsuitable as a sole tool in clinical decision-making.40
It is well established that frailty predicts adverse health outcomes and thus seems natural that identifying patient’s frailty status would be correlated to short-term mortality.41 As such, Wou et al42 evaluated the predictive value of different frailty rating scales on short-term mortality; however, their predictive properties were poor, AUC ranging from 0.44 to 0.69 limiting their use in stratifying risk in older patients discharged from hospital units.
Drame et al proposed a mortality risk index after a 6-week follow-up based on three items: malnutrition risk, dependency and delirium; the predictive value was good (AUC 0.71), but this tool has not been validated in broader population sets (n=1306).33 These various tools may seem interesting but many of them have not been validated in different populations.26 37
Cardona et al developed a clinical prediction tool CriSTAL which identifies risk of death within 3 months of admission among older patients. Based on objective clinical criteria, this tool has been tested in different populations, such as Australian, Danish and Irish, and seems to be strongly indicative of risk of death (AUC 0.795).27 Validated in older populations, the CriSTAL screening tool presents certain limits in terms of feasibility and may be time-consuming in clinical routine due to its numerous predictive variables. As the testing of numerous variables is known to reduce the generalisability of a predictive model, our study followed the suggestions of Cardona et al to reduce the total number of items without sacrificing predictive accuracy. Recently, Cardona et al have demonstrated that a minimum of 5 of 29 variables were sufficient for accurate prediction.43
Limitations
There are certain limitations in this study. First, this is a single-centre study based on the recruitment of patients in an acute geriatric ward so its generalisation to other populations is yet to be determined.
Moreover, although the cohort was randomised, the patient set may have a disease bias given the disproportionate representation of certain diseases such as chronic heart failure which could affect the results.
Another limitation is that the variables selected were based on the CriSTAL screening tool, which is based on a narrative review of certain prediction variables which may have led to overlooking other variables which should have been considered as mortality predictive factors.
Further studies in other real-life settings would be vital to measure the applicability of the WHALES criteria in different settings before greater generalisation.
Finally, the clinical implications of the prediction score and the in-hospital mortality must be interpreted with caution; the score should be interpreted under the clinician’s judgement, and would be used as a guidance but not substitute it.
Conclusion and perspectives
Our study differs from other studies as it is based on an easy routine screening tool and with data available at day 1 of hospitalisation. Other studies have developed prediction models based on numerous clinical variables from ER to hospitalised data: administrative, clinical examination or complementary examinations.26 35
The WHALES criteria may improve identification of palliative patients with the use of a predictive mortality tool facilitating advance care planning with family and other healthcare professionals. As such, proactive palliative care may be implemented and improve patients’ quality of their remaining life.44 However, it is important to keep in mind that the goal of this revised score is not to predict death with certainty but to help identify patients more likely to die and thus to adapt their medical care.
Moreover, this predictive score may help when discussing potential interventions or life-threatening decisions encountered during hospitalisations and help reoptimise patients’ prescriptions according to patients’ life expectancy.
Data availability statement
Data are available upon reasonable request.
Ethics statements
Patient consent for publication
Ethics approval
The study protocol was reviewed and approved by the Committee for the Protection of Persons of the Southwest and Overseas III region on 19 September 2016 (Reference: 2016-A00116-45). This organisation depends on the French Ministry of Health. All patients signed a written informed consent form prior to the study.
Acknowledgments
The authors would like to thank Armand Steinmeyer for his constructive feedback and Maud Jerome who contributed to this research.
References
Supplementary materials
Supplementary Data
This web only file has been produced by the BMJ Publishing Group from an electronic file supplied by the author(s) and has not been edited for content.
Footnotes
Contributors All authors have read and approved the manuscript. Guarantor—ZS. Conceptualisation—JT and FN. Methodology—JT, SHYK, AP, ZS and FN. Writing (original draft preparation)—ZS, JT, AP, SHYK and FN. Writing (review and editing)— ZS, JT, AP, SHYK and FN. Supervision—JT, AP and FN.
Funding This study was supported by a grant from the French Ministry of Health, Clinical Research Hospital Program 2015, from the Toulouse University Hospital registry number NCT03549585 and a grant from the Fondation de France.
Disclaimer The funding bodies peer reviewed and approved the study protocol.
Competing interests None declared.
Provenance and peer review Not commissioned; externally peer reviewed.