A person based formula for allocating commissioning funds to general practices in England: development of a statistical model
BMJ 2011; 343 doi: https://doi.org/10.1136/bmj.d6608 (Published 22 November 2011) Cite this as: BMJ 2011;343:d6608
- Jennifer Dixon, director1,
- Peter Smith, professor2,
- Hugh Gravelle, professor3,
- Steve Martin, research fellow4,
- Martin Bardsley, head of research1,
- Nigel Rice, professor3,
- Theo Georghiou, senior research analyst1,
- Mark Dusheiko, research fellow3,
- John Billings, professor of health policy5,
- Michael De Lorenzo, vice president6,
- Colin Sanderson, professor of operational research in health care7
- 1The Nuffield Trust, London W1G 7LP, UK
- 2Imperial College Business School & Centre for Health Policy, London SW7 2AZ
- 3Centre for Health Economics, University of York, York YO10 5DD, UK
- 4Department of Economics, University of York
- 5Graduate School of Public Service, New York University, New York NY 10012-9604, USA
- 6Health Dialog, Portland, ME 04101, USA
- 7Department of Health Services Research and Policy, London School of Hygiene and Tropical Medicine, London WC1E 7HT
- Correspondence to: J Dixon jennifer.dixon{at}nuffieldtrust.org.uk
- Accepted 20 September 2011
Abstract
Objectives To develop a formula for allocating resources for commissioning hospital care to all general practices in England based on the health needs of the people registered in each practice
Design Multivariate prospective statistical models were developed in which routinely collected electronic information from 2005-6 and 2006-7 on individuals and the areas in which they lived was used to predict their costs of hospital care in the next year, 2007-8. Data on individuals included all diagnoses recorded at any inpatient admission. Models were developed on a random sample of 5 million people and validated on a second random sample of 5 million people and a third sample of 5 million people drawn from a random sample of practices.
Setting All general practices in England as of 1 April 2007. All NHS inpatient admissions and outpatient attendances for individuals registered with a general practice on that date.
Subjects All individuals registered with a general practice in England at 1 April 2007.
Main outcome measures Power of the statistical models to predict the costs of the individual patient or each practice’s registered population for 2007-8 tested with a range of metrics (R2 reported here). Comparisons of predicted costs in 2007-8 with actual costs incurred in the same year were calculated by individual and by practice.
Results Models including person level information (age, sex, and ICD-10 codes diagnostic recorded) and a range of area level information (such as socioeconomic deprivation and supply of health facilities) were most predictive of costs. After accounting for person level variables, area level variables added little explanatory power. The best models for resource allocation could predict upwards of 77% of the variation in costs at practice level, and about 12% at the person level. With these models, the predicted costs of about a third of practices would exceed or undershoot the actual costs by 10% or more. Smaller practices were more likely to be in these groups.
Conclusions A model was developed that performed well by international standards, and could be used for allocations to practices for commissioning. The best formulas, however, could predict only about 12% of the variation in next year’s costs of most inpatient and outpatient NHS care for each individual. Person-based diagnostic data significantly added to the predictive power of the models.
Introduction
Since 1991, the English National Health Service (NHS) has experimented with allocating budgets to general practices with which they are expected to purchase (commission) hospital care for the NHS patients that are enrolled (registered) with them. The first incarnation of this policy was general practice fundholding in 1991, in which volunteer practices were given an NHS budget by the then local NHS health authorities with which to commission certain planned elective care, outpatient care, community health services, and prescribing.1 In the early days, the way the budgets were set for fundholding practices was partly from the past use of care by their registered populations and partly from a resource allocation formula based on the health needs of that population.2
It was recognised at the time that the inadequate data available, plus the small populations in each practice (on average about 7000) covered by the budgets, meant a resource allocation formula based on needs indicators to set practice budgets would not by itself be predictive enough of future costs and thus practices would be put at undue financial risk.3 4 A specific issue was that there were inadequate data on health need, and proxy indicators were necessarily used—such as socioeconomic deprivation drawn from census data. In principle, overspending practices had to make good any budget deficit in future years or be stripped of their fundholding status. In practice, however, the local health authority often made up deficits, and it was likely that budgets to fundholders were overgenerous in the early years.2 Surpluses could be retained by fundholders to enhance services for patients but could not be taken as direct income by the general practitioners. There were some arrangements for managing financial risk—for example, the cost of the care above a threshold per person per year (£20 000) was borne by the local NHS health authority.
Fundholding developed over the 1990s, with the formation of “multifunds” (where a number of fundholding practices could pool NHS resources for commissioning hospital care) and “total purchasing pilots” (where single or groups of practices could opt to hold an NHS budget covering a wider range of services including emergency care).5 The way of setting budgets for these groups by the local health authority was essentially the same as for fundholding practices, but, because of the inherent unpredictability and cost of emergency care, the risk of overspending the budget by total purchasing pilots was cushioned even more actively by the local health authority.
These initiatives were abolished in 1997, but in 2005 another variant—practice based commissioning—was implemented and remains in place today. Under this policy, NHS budgets to general practices cover a wider set of services than in fundholding—most hospital care as well as community services. NHS budgets for commissioning practices are set by their host NHS primary care trust (which replaced NHS health authorities) based on historical expenditure by the practice population and a “fair shares target” allocation.6 This “fair shares target” is based on a resource allocation formula that takes account of the size of the population registered with the practice and the likely health needs of that population (for example, the age and sex profile and the socioeconomic deprivation of the population). The aim of the “fair shares” resource allocation formula is the same as all resource allocation formulas used in the NHS since the 1970s—to secure, through resource allocation, equal opportunity of access to healthcare for people at equal risk.7 8 Until 2010-1 the “fair shares” formula for practice based commissioning was similar to that used for distributing NHS resources from the Department of Health to the 151 primary care trusts across England.9 The national formula enabled a primary care trust to calculate a “target allocation” for each of its practices, and the trust then determined a “pace of change” towards this target from the previous year’s budget.
Additionally, a variety of local arrangements are used to spread the financial risk of overspending or underspending the budget by commissioning practices. For example, the practice budgets are in most instances “notional” (where the primary care trusts largely bear the financial risk of overspending) and not “hard” (where the practices would bear most of the financial risk). This is for two related reasons. First, it was recognised that the “fair shares” formula was still not accurate enough to predict the need for healthcare in a practice in any budget year. Second, the size of population registered with each practice was too small to bear the financial risk for much inpatient care, the costs of which are inherently unpredictable. Both of these reasons meant that there was a substantial risk that a practice might underspend or overspend on the basis of chance. To reduce this risk, practice budgets for commissioning have been effectively pooled for all general practices within the geographical boundary of the primary care trust level (covering approximately 300 000 population), so the trust would each year underwrite financial losses and gains for practices against their notional budgets. In effect, therefore, practice based commissioning has resulted in very “soft” budgets for practices, with few penalties for overspending practices or rewards for underspending. This has weakened incentives for practices to engage in commissioning hospital care, and practice based commissioning was widely seen to be ineffective.10
The arrangements for practice based commissioning remain in force. However the government elected in May 2009 outlined an extensive set of reforms for the NHS in England.11 The resulting bill currently going through parliament proposes the replacement of primary care trusts by clinical commissioning groups. These bodies are to be made up of groups of general practices that, from April 2013, will be responsible for commissioning community services and most hospital care for the population registered with their constituent general practices.11 12 A maximum or minimum size of population to be covered by clinical commissioning groups has not been specified. Thus these bodies are not intended to cover populations bounded by census-defined geographical boundaries (as were the primary care trusts before them), rather they are to be defined by the populations registered with their constituent general practices.
Under the proposals, primary care trusts and the administrative tier above them (strategic health authorities) are to be abolished. Instead, in England a new national NHS Commissioning Board fully operating from October 2012 is to be formed that will be responsible for commissioning a defined set of highly specialised and high cost services and for distributing resources for all remaining care (about £65bn per annum) to the new clinical commissioning groups. These groups will have to go through an authorisation process managed by the NHS Commissioning Board to ensure they are fit to commission care. It is likely that the NHS Commissioning Board will allocate “hard” budgets to authorised clinical commissioning groups, in that the groups will be responsible for any surpluses or deficits in the budget. It is not yet clear if clinical commissioning groups themselves would allocate hard rather than notional budgets to each constituent practice. However, the intention is that authorised clinical commissioning groups, and the practices that make them up, will together manage the financial risk of their commissioning budget.
Central to the new arrangements is the need to find a more accurate way of setting a commissioning budget for the proposed clinical commissioning groups that reflects the size of population covered by their constituent general practices and the health needs of this population and has effective arrangements for distributing financial risk across the practices, the clinical commissioning groups, and the NHS Commissioning Board. Fair share allocations are also a means of benchmarking practice expenditures, enabling comparison of actual needs to predicted healthcare expenditures across practices (within clinical commissioning groups) and over time. Given the likely role by clinical commissioning groups in overseeing the quality of primary care, accurate needs based allocations can facilitate clinical best practice by highlighting practices with appropriate or efficient levels of expenditure and those not. Hence, the need to accurately predict needs related (justifiable) healthcare expenditures for general practices. Better information and technical advances that allow data linkage now mean that there are much more NHS data available at person level indicating health needs, which may be exploited to develop a resource allocation formula.
This paper reports the results of a study to explore the feasibility of developing a needs based formula that was accurate enough to serve as a basis for setting budgets for the next year’s expenditure on hospital care for the population registered with each general practice. The paper describes the methods used to devise the formula, and how the resulting model can be used to help set budgets for general practices.
Methods
Aims and scope
The aim of the project was to develop a national formula that could be used to distribute NHS resources within a local primary care trust to general practices for commissioning hospital care on behalf of their registered populations. The intention was to exploit routinely available, person based data on health needs—hence the description “person based resource allocation” (PBRA).
The formula was to be used to calculate a fair shares target allocation for each general practice in England. The objective would be for practices to move from their current spending levels to the target allocation over a period of years, at a pace to be determined by their local primary care trust (subsequently clinical commissioning group). Note that the PBRA formula was intended to help allocate resources from primary care trusts to practices (a separate formula is currently used to allocate NHS resources from the Department of Health to primary care trusts9).
The scope of the PBRA formula was to cover the distribution of funds for commissioning inpatient care (including critical care and accident and emergency) and outpatient care. It covered only NHS expenditure on NHS patients registered in general practices in England, and excluded spend on individuals not registered with a general practice, maternity care, mental healthcare, community health services, prescribing, and primary care—all of which are covered by different allocation formulas.6 Historically, there has been a separate formula for mental health because the data available to construct a formula are different, and the factors influencing need for mental healthcare were thought to be sufficiently different from those for more general acute care. About a third of NHS expenditure lies within the scope of the proposed PBRA formula.
Broad approach
For over 20 years, the English NHS has adopted an empirical approach to developing formulas to distribute NHS resources between geographical areas, in which a statistical model is developed to predict the costs of care for an area based on the needs of the local population, after adjusting for any variations in supply.7 8 We adopted the same principles, but innovated in three main ways. First, we developed a model to predict the costs for individuals (each individual registered in a practice in England), not the population of an area. Second, the model was prospective in that it used past data to predict future costs. Third, the model exploited much more than hitherto information on the health needs of each individual (diagnostic information recorded from previous inpatient records).
Multivariate statistical models were developed in which the cost for an individual in one year (2007-8) was predicted by a set of explanatory variables constructed from information on that individual in the two previous years (2005-6 and 2006-7). The explanatory variables included measures of individual level health needs (age, sex, diagnoses recorded on a person’s previous inpatient admissions), indirect measures of health need attributed to individuals from data on a local area (for example, socioeconomic deprivation in the area in which the individual resided), and attributed supply factors (for example, the supply of local hospital beds and the quality of care provided by the individual’s general practice). The models predicted the costs for each unique individual. However, because the interest was in setting target allocations for practices, these predictions were aggregated to predict costs for each practice population.
The two main stages in this process are outlined below: assembling data and developing the model.
Assembling data
The creation of the study dataset was a major undertaking that involved securing access to the relevant large datasets, analysing their quality and “cleaning” them where necessary, and then linking them at the level of each individual registered with a general practice.
The main constituent datasets
Two main sources of NHS data were used:
Hospital episode statistics (covering all inpatient admissions and outpatient attendances) for people resident in England over the three year period 2005-6 to 2007-8
Data on each person registered with a general practice in England over the same period (the “member file”). The member file contained 57 million individuals.
Hospital episode statistics data, obtained from the NHS Information Centre, contained information on each individual who had an outpatient or inpatient encounter—for example, a unique patient identifier (NHS number), area of residence (census areas called “lower layer super output areas” with an average population of 1500), age, sex, use of hospital care, and diagnostic information from each inpatient admission. Data on use of other forms of care by an individual, such as use of primary care and community services, are not currently collected nationally and therefore were not available as indicators of health need.
The member file contained information on each individual who had been registered with a general practice over the period: NHS number, information on area of residence, age and sex, practice of registration, and length of time of registration. These data were obtained from the NHS National Strategic Tracing Service, now called the NHS Personal Demographic Service. The data were examined and cleaned where appropriate.
Linking datasets at individual level
The member file was linked to the hospital episode statistics data via unique NHS numbers, which had been encrypted by the data suppliers before being provided to the project team to preserve patient confidentiality. Relevant permissions to obtain and link data in this way were obtained from the Data Management Subgroup of the Ethics and Confidentiality Committee of the National Information Governance Board (www.nigb.nhs.uk/ecc). Extensive checks were performed on both datasets to remove duplicates and other inaccuracies. Over 98% of hospital episode statistics records could be linked to the member file each year.
In each year, most individuals in the member file had no inpatient admission or outpatient attendance. For these individuals, all that was known about them was the basic information noted above in the member file (age, sex, area of residence, and general practice registered with). But 14% of individuals had at least one inpatient admission in a year, and 30% had at least one outpatient appointment. For these, more information was available relating to health need, such as the diagnoses recorded on admission.
Constructing the dependent variable—costs per individual in 2007-8
The costs for 2007-8 of NHS inpatient and outpatient care (excluding costs for services outlined above) for each unique individual registered with a general practice on 1 April 2007 was estimated by costing every inpatient admission or outpatient attendance that they had incurred. Because the interest was in modelling the costs of commissioning care, we sought wherever possible to use the prices paid by commissioners. We therefore used national tariff prices (Healthcare Resource Group version 3.5)13 or, where this was absent, the average national reference cost14 to cost an individual’s inpatient and outpatient activity. We could cost 96% of inpatient admissions and 93% of outpatient attendances in 2007-8 with the national tariff, and the rest were costed using national reference costs or specialty average cost.
Constructing explanatory variables
To develop the model, information from 2005-6 and 2006-7 on each individual was used to predict their costs in 2007-8. The information from 2005-6 and 2006-7 available on each individual can be categorised into individual level data and into area level data (data attributed to individuals on the basis of where they lived).
Individual level data—For each individual with a unique NHS number, information on age and sex were available from the member file as noted above. For those individuals who had been admitted to hospital in 2005-6 and 2006-7, more information was available, including the ICD-10 diagnostic codes recorded in their hospital inpatient records. As yet, across England practically no diagnoses are recorded in hospital episode statistics for outpatient care, so these were not available for use. Instead, other information on outpatient care used by an individual was used in developing models—for example, the specialty in which an outpatient attendance had occurred.
A variety of methods of grouping the large number of ICD-10 codes recorded on inpatient admissions were tested,15 16 but we found that statistical models using the standard 152 ICD-10 groupings developed by the NHS Information Centre17 performed at least as well as models using other diagnostic groupings. For each episode of care in an admission, a primary diagnosis and several secondary diagnoses are usually recorded. We experimented with a variety of approaches towards modelling primary and secondary diagnoses, but found that statistical models which included primary and all secondary diagnosis codes from inpatient admissions in the previous two years performed as well as more complex approaches. We therefore recorded a diagnosis as present wherever it was recorded in either of the explanatory years.
Other potential measures of health needs could have been constructed, such as the number of times the individual used inpatient or outpatient services (an indicator of severity of any diagnosis). Although this proved highly predictive of future costs, we could not use such variables in the modelling because they would also be directly influenced by the local supply of services and their use in a resource allocation formula may perversely encourage excess hospital use.
We also noted whether an individual had had a privately funded inpatient admission in an NHS hospital in 2005-6 or 2006-7, hypothesising that this would have a negative impact on the individual’s NHS costs in 2007-8. In effect this variable was treated as an indicator of health need—the greater use of privately funded care, the less health need affecting NHS costs.
Area level data—Some information that could indicate the health needs of an individual is not collected routinely when an individual registers with a practice (as in the member file) or uses NHS care (as in hospital episode statistics); such as level of education, whether the individual is a pensioner who lives alone, or whether he or she lives in a socioeconomically deprived area. However, some information of this type is collected through the national census or through other administrative means (such as benefits claims data) and made publicly available at an area level rather than an individual level. The individual level data used in this study were supplemented with a large volume of data related to the small areas in which the individuals lived, obtained from various official public sources or calculations by the study team. The varying area characteristics were attributed to individuals in the member file based on their area of residence or, in some cases, based on the general practice they were registered with or main hospital they had attended, as is usual practice in previous analyses of this type.
Two broad groups of area based, attributed variables were used in this analysis: those that might indicate health needs, and those that might indicate the supply of healthcare. Attributed needs variables included those from the index of multiple (socioeconomic) deprivation18 and the prevalence of specific chronic diseases by practice as recorded through the GP quality and outcomes framework.19 Attributed supply variables included the number of local hospital beds available, or the number of doctors in the general practice where the individual was registered. Other potential supply variables included the primary care trust area in which the individual resided.
In developing the models, over 160 attributed needs variables and over 130 attributed supply variables were tested.20 These variables were selected as potential explanatory variables either because they had been consistently shown to have had impact in previous resource allocation formulas or because they had been associated with variations in use of care from small area analysis studies, or were plausible measures of health need (such as asthma prevalence by practice recorded through the quality and outcomes framework).
Modelling a resource allocation formula
Models were developed using data from 2005-6 and 2006-7 to predict costs in 2007-8, for each individual registered with a practice in England on 1 April 2007. The predicted costs for each individual in each practice for 2007-8 were summed to form the predicted costs for each practice. Predicted practice costs were then compared with each practice’s actual costs for 2007-8 to assess how the model performed. Actual practice costs for 2007-8 were calculated by summing individual costs as described above.
A variety of econometric modelling strategies were investigated. However, as is often the case with large samples, single stage ordinary least squares regression performed as well as other methods, and so was selected on the grounds of simplicity.
The models were developed using three separate samples, each comprising five million patients:
A 10% (5m) estimation sample of individuals was used to estimate models of individual level costs
A different 10% (5m) validation sample of individuals was used to validate the results of the estimation sample
A 10% random validation sample of practices containing every person registered with these practices (5m) was used to validate the results of the estimation sample at practice level.
The use of a 10% sample was necessary to make model estimation computationally feasible, but proved large enough to yield robust results, with little difference observed between models estimated on different samples. This meant that the model could be developed on one sample (the estimation sample), and the results validated using two further samples. With such a large number of potential explanatory variables, it was possible to envisage a wide range of model specifications, and more than 200 different models were tested. However, for simplicity the results of only five basic categories of models are discussed here:
Model 1—using only a person’s age and sex to predict future health expenditure
Model 2—using age, sex, and a further person level variable, diagnosis history (diagnoses recorded in each inpatient admission)
Model 3—using age, sex, diagnosis history, and dummy variables denoting which primary care trust a practice was located in (the baseline model)
Model 4—model 3 plus a full set of attributed needs and supply variables (the full model)
Model 5—model 3 but with a limited set of attributed needs and supply variables selected mainly on the basis of predictive power and plausibility (the parsimonious models).
The performance of the models was compared according to three criteria—the coefficient of determination (R2), the root mean squared error, and the mean absolute prediction error. We sought out parsimonious models (with a small number of explanatory variables) because of the need to have a simple model that could be readily described. The smaller number of variables can also help avoid the problem of “overfitting” the model (when a model describes random noise rather than the underlying relation between variables). The smaller number of variables in the parsimonious models were selected by a documented procedure of stepwise elimination from the regression of variables showing weak statistical significance or perverse signs. The full modelling strategy including selection of variables is described elsewhere.18
The models were developed using data on a set of individuals registered in a practice at one point in time, 1 April 2007, and using information on their use of NHS care over the previous two years (2006-7 and 2005-6). Thus information on people who had died in 2006-7 and 2005-6 were excluded from the analysis. However, the costs of care for people at the end of their lives will have been included in the formula for all those people registered on 1 April 2007, some of whom will have been in their last months of life. Therefore the exclusion of people who die earlier than 1 April 2007 should not have resulted in a systematic bias in the modelling.
The modelling was conducted using STATA version 10.
Results
Main findings
Table 1⇓ summarises the main findings for the five groups of models with respect to their R2 performance in predicting both individual level costs and practice level costs in 2007-8. For each of the five groups of models, the results for only one model in the group are shown—the one with the highest predictive power in each group. For simplicity, performance is indicated just by the R2 values of each model, although the ranking of models was very similar when other measures of model performance were used.
Summary results of five groups of models for allocating funds to general practices in England for commissioning hospital care; predicting costs for 2007-8 using data from 2005-6 and 2006-7
Model 1 (age and sex only) predicted only 3.7% of future costs at individual level, but 34.4% at practice level. Adding diagnosis history as a variable (model 2) improved predictive power from 3.7% to 12.6% at individual level, and from 34.4% to 60.8% at practice level. Adding dummy variables to denote primary care trust (model 3, the baseline model) boosted predictive power at practice level to 74.4% but added little at individual level. This probably reflects trust-wide factors such as the overall level of funding and trust policies. Adding the full set of 135 attributed needs and 65 supply variables (model 4, the full model) added to the predictive power only slightly at practice level (to 78.5%) and negligibly at individual level. Model 5, which used a more parsimonious set of only seven attributed needs and three supply variables, had a similar predictive power at individual level and practice level as the full model 4.
Table 2⇓ shows the variables which made up the parsimonious model 5, including the value of the coefficients for the seven attributed needs variables and three supply variables. The model’s seven attributed needs variables indicated poverty (people in social rented housing, disability allowance claimants), educational disadvantage (people aged 16–74 years with no qualifications, proportion of students in the population), income (mature city professionals; people who had had a privately funded inpatient episode of care), and asthma prevalence (the only clinical needs indicator to be selected). The three supply variables to be selected were quality of stroke care, access to magnetic resonance imaging, and the catchment population of the hospital trust which supplied the individual’s practice with the largest number of inpatient admissions.
Variables and coefficients in the parsimonious model (model 5) for allocating funds to general practices in England for commissioning hospital care; predicting costs for 2007-8 using data from 2005-6 and 2006-7
Added value of individual level diagnostic data
Table 3⇓ shows the added value of using individual level diagnostic data (in addition to the area based attributed health needs variables) in models to indicate health needs. The added value of the individual level diagnosis variables is considerable, but depends on the other variables included in the model, and the sequence in which they are added. In the full model (model 4) and parsimonious model (model 5) the individual level diagnosis variables improved the predictions over attributed variables at practice level (from 71% to 78% and from 69% to 77% respectively), but to a much higher degree at individual level (from 4% to 12%). But, over and above age and sex, the individual level diagnosis variables add considerably (about 26%) to the predictions at practice level. The table also confirms the only modest reduction in explanatory power when moving from the full model 4 to the parsimonious model 5.
Table to show the added predictive power of including person-based groups of variables to the five models for predicting costs to general practices for commissioning hospital care for 2007-8, using data from 2005-6 and 2006-7
Differences between actual and predicted costs
The models produced predicted per capita costs in each practice in 2007-8, and these were compared with actual per capita costs in that year. Table 4⇓ shows, for each model, the percentages of practices for which the difference between actual and predicted per capita costs summed across the practice was ≤3%, ≤5% or ≤10%. The table shows that, with the parsimonious model (model 5), actual costs were ≤10% less than predicted costs for 35% of practices, while actual costs were ≤10% greater than predicted costs for 33%.
Percentages of 797 general practices* for which differences between actual and predicted per capita costs† were ≤3%, ≤5%, or ≤10%: results for the five models predicting costs to practices for commissioning hospital care for 2007-8 using data from 2005-6 and 2006-7
This means that, without any arrangements for managing financial risk (such as pooling risks for high cost individuals across a larger population, such as a primary care trust), 68% of practices in England are likely to have actual costs in 2007-8 within 10% of the predicted costs with model 5: therefore, 32% are likely to exceed or undershoot their predicted costs by greater than 10%. There was a clear correlation with practice size—the smaller the registered practice, the weaker the models were in predicting next year’s costs. This underlines the critical importance of designing methods of sharing financial risk if practices (especially small practices) are to hold hard budgets in future.
Suggested optimal model
When recommending a statistical model for use as a basis for resource allocation, a number of criteria must be considered, including statistical robustness, face validity, parsimony, and freedom from perverse incentives. On the basis of the above analysis, we recommended that model 5 be used. In particular, a parsimonious model was preferred over a model with a full set of attributed needs and supply variables because of the simplicity and the negligible loss of performance.
Estimating a “distance from target allocation” for each practice
We estimated a “distance from target” for a practice using the new PBRA (person based resource allocation) formula by calculating a distance from target ratio, which was the “needs index” divided by the “costs index.” The needs index was the practice share of the total need of the primary care trust (based on the PBRA formula only) divided by the practice share of the trust population in 2007-8. The costs index is the practice share of the total trust costs of commissioning divided by the practice share of the trust population in 2007-8. The total trust cost of commissioning was calculated by summing the costs in 2007-8 of all individuals (as described above) in practices and living within the trust boundaries. A value of the distance from target ratio greater than 1 indicates that the target practice’s need exceeded its costs, relative to the primary care trust average. We found 61% of practices to be more than 5% above or below their target, and, of these, 35% were more than 10% and 14% were more than 20% above or below their target.
We extended the analysis from the sample to all practices in England (excluding those with registered populations of <500 (16 grossly outlying practices)). Table 5⇓ gives more detail of the characteristics of the 5% (393) of practices that were furthest “under target,” the 5% (372) of practices that were furthest “over target,” and the 50% (4075) of practices that were closest to the median. Compared with the last group, the 5% of practices most over target tended to have a lower list size and had registered populations with larger proportions of those living in socioeconomically deprived areas, who were migrants, aged <15 years, who left the practice list, and who incurred high costs (>£50 000 per person per year and >£100 000 per person per year). These practices also tended to have a lower proportion of people aged >65 years.
Characteristics of general practices that were furthest from their target allocation based on the “person based resource allocation” (PBRA), 2007-8 . Values are means (standard errors)
The 5% of practices that were furthest under target tended also to have a lower list size and had a greater proportion of their registered population who left the practice list or were migrants, but lower proportions of the registered population aged <15 or >65 years, and lower proportions of the population incurring high costs relative to the 50% of practices that were closest to the median. A greater proportion of under target practices served sizeable populations of students (adults) in full time education.
Figure 1 ⇓ shows the “distance from target” by practice size for all practices in England (excluding those with registered populations of <500). Practices with smaller registered populations were more likely to be furthest under or over target. This is not surprising because the predictive power of PBRA, and other resource allocation models, is lower as practice population size reduces.
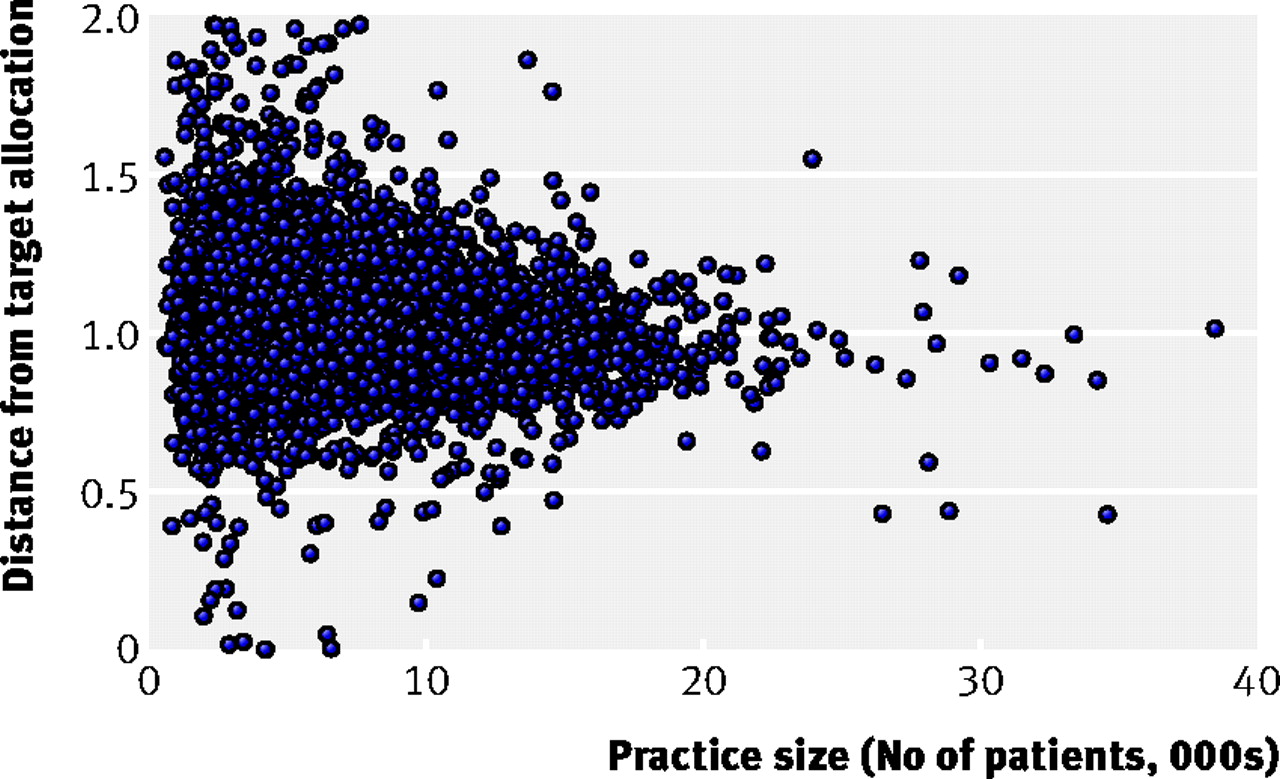
Distance of general practices in England, relative to England mean, from their target “person based resource allocation” (PBRA) by practice size (2007-8 data). Values are for all practices in England except for 16 outliers, all with registered populations of <500
Calculating target allocations for practices
As outlined above, the intention was that the formula would produce a means to calculate a target allocation for general practices, not for individuals. It was therefore necessary to devise a method of aggregating individual predictions to calculate practice target allocations. In doing so, it is important to note that the requirement was to share out a fixed budget for a primary care trust between its constituent practices in a fair and systematic manner to produce a fair shares target allocation. Three considerations complicate this process: the treatment of supply variables, data lags and changes to the practice population, and “list inflation” (the accuracy of the populations listed as being registered with each practice).
Treatment of supply variables
The formula as shown above contained needs and supply variables. In calculating the needs weights per individual, the value of the supply variables should not influence the target allocations for practices. This is because the point of the formula is to distribute available resources on the basis of health needs as far as possible, not influenced by any variations in the supply of services that the individual had access to. We followed the usual practice in the development and application of resource allocation formulas by including supply variables in the formula, since they help to predict costs, but then setting the value of the supply variables for each individual (including the primary care trust dummies) to a national mean value when calculating cost predictions. This effectively means that the needs weighting for the individuals will not be affected by variations in access to health facilities (supply factors), but will rather be based only on the needs factors in the formula such as age, sex, diagnoses recorded on inpatient admissions, and the attributed needs variables.
Data lags and changes to practice populations
Setting target allocations using the PBRA formula on the basis of directly summing the predicted needs of each unique individual in each unique practice in the way outlined above is not practicable given current data and methods. The two main reasons are data lags and changes in practice populations.
Data lags—The formula was developed to be applied to help inform allocations to commissioning general practices in 2010-1. In developing the model, the data used on individual level needs were based on data at least 18 months old because of lags in the production of cleaned hospital episode statistics at national level by the NHS Information Centre. Thus the PBRA formula developed for allocations in April 2010 to practices across England was based on an estimate of the health need of an individual using hospital episode statistics data from 2005-6 to 2006-7. Notwithstanding improved data collection efforts, such lags will always be a feature of resource allocation methods. The problem is that the health needs of individuals may change during the lag period.
Changes to the practice registered population—Perhaps more significant was that during the lag period there might be significant changes to a practice’s registered population because of births, deaths, and people moving to and from the area. Although it is possible to use the formula to estimate a needs score for each unique individual in England who moved residence or practice during a year, and assign it to the new practice the individual had registered with, this could prove a complex task across the whole country. Furthermore, there would also be some health needs, and thus costs, of newly registered individuals that would need to be included (such as babies born in the future budget year or new immigrants) but that could not be predicted by the formula. Also there would be predicted health costs for the whole year for people who had died during the year that would need to be excluded after the date of death.
We therefore developed a pragmatic solution to these challenges. Instead of calculating needs weights for each unique individual in each practice, then summing them to obtain a practice weighting, we calculated the needs weights for groups of individuals (38 age-sex groups) for each unique practice. In these groups the average values of the needs and supply variables in the formula within a practice hardly varied at all over the three years 2005-6, 2006-7, and 2007-8 (the correlation was 0.9919), and so using these averages to calculate needs weights per practice was more robust than using individual level variables.
This approach also allowed us to address the challenge of changing practice populations, including births, deaths, and moves. The average needs score for each of the 38 age-sex groups for the practice could be multiplied by the number of people in each group in the practice using the most up to date registered population at budget setting day. Thus, any people moving to the practice would be assumed to have the average predicted needs score of their age-sex group in that specific practice until they had built up their own needs history at the practice from hospital episode statistics data. The health needs (and thus costs) of babies in their first year would be assumed to be the average for that age-sex group. Use of the most up to date practice registration data at budget setting day (approximately three months before the start of the budget year in any given year) allows recent births and deaths in the practice population to be accounted for.
The target allocations to practices for commissioning could then be calculated by sharing out the relevant primary care trust budget between practices according to these weightings. Once the target allocation had been set in this way, it would be for the primary care trust to decide if and when to make further adjustments to account for issues such as population turnover, changes in list size, new practices, “distance from target,” and pace of change to the target allocation.
Accuracy of population size registered with general practices
Because the commissioning budgets to practices are allocated on the basis of their registered populations, a potentially important problem is that of “list inflation,” when the practice registered list erroneously includes people who have moved away or died. Nationally, the combined population registered with general practices in England exceeds the mid-year estimates from the Office for National Statistics by 6%,21 and the largest variations are in London (although not for all areas). The discrepancy could be because general practices’ registered lists are a more accurate reflection of population size than mid-year estimates based on census data collected by the Office for National Statistics. Some London local authorities, for example, have argued that official population estimates from the census considerably underestimate their true population.22 Alternatively, practice registration data may not be accurate, possibly because of poor list management or high turnover due to population migration. In 2006 the National Duplicate Registration Initiative resulted in 185 000 registrations being cancelled across England.23
List inflation has been a longstanding problem for any approach to resource allocation to practices, particularly if the inflation is not evenly distributed across all practices within a primary care trust. It has been recognised that basing budgets for practices on practice registration data may create perverse incentives for practices not to maintain accurate registered lists. Therefore, the Advisory Committee on Resource Allocation has recently recommended robust audit mechanisms to monitor list quality, and implementation of recent recommendations by the latest National Duplicate Registration Initiative.24
Discussion
Principal findings of the study
We have shown that using the new PBRA formula to set target allocations for practices is challenging but feasible. The formula as described was incorporated into the Department of Health’s “fair shares” guidance to primary care trusts to help them set budgets for commissioning practices from April 2010.6 Our results show that a person based resource allocation model with good predictive power can be developed for the NHS: the parsimonious and full models could predict over three quarters of the variation in next year’s costs at practice level. The best formulas, however, could predict only about 12% of the variation between practices of next year’s costs of most inpatient and outpatient NHS care for each individual. Therefore, we do not recommend that such formulas are used at the individual level, such as in constructing a unique, person based allocation for commissioning that could be portable to a new practice.
The performance of the models is good by international standards,25 26 which is probably due to several factors: the availability of a large amount of similar routine information collected electronically on each patient across NHS and non-NHS hospital providers across England (because of the NHS being a single payer system), a means of tracking use by individual patients over time (through the unique NHS number), and having information on almost all patients eligible for NHS care through registration with a general practice.
With current information, it is not possible to know what the “true” level of health needs is in each practice. However, compared with previous methods, the PBRA formula makes far greater use of information from individuals, relies less on area level information attributed to individuals, and is more predictive of future costs. As such, it is an improvement on current methods and lays the basis for further refinements using more extensive datasets, such as community based diagnoses.
Information on diagnoses previously recorded at hospital admission was particularly powerful. This effect was greater in predicting future costs for individuals than practices. We relied on publicly available aggregate groupings of ICD-10 diagnoses as the diagnostic indicators in the models. Future research might develop these further into more clinically meaningful groups, and analyse the impact on the predictions of future costs.
Although the predictive power of some of the PBRA models tested was relatively high, there was still notable variation between predictions and actual costs at practice level for 2007-8. For example, using the parsimonious model (model 5) to set a target allocation, we would expect about a third of all practices to incur costs more than 10% above or below the predicted level in the budget year. This finding at present can only be a rough guide to fluctuations in a real practice budget. This is because, in reality, practices are unlikely to be given a budget equal to the predicted costs or target allocation, as their real budget will be set somewhere between a historical level of spend and a target allocation. Also we calculated “actual” costs for the practice population as activity multiplied by national tariffs or national reference costs; in reality, some primary care trusts may negotiate prices lower than these amounts. Further analysis (see full report20) showed that many of the general practices exceeding this 10% variance were small (registered population below 3000) as expected, and the larger the population covered by the practice, the lower the percentage difference between the actual and predicted costs per person.
This means that some risk sharing arrangements across populations larger than individual practices will be required, as proposed in the new Health and Social Care Bill.27 Pooling financial risk within the proposed clinical commissioning groups will be one method of doing this, and commissioning high cost specialised services at national level by the NHS Commissioning Board is another. Further empirical work is necessary to understand further the extent to which practices would be exposed to financial risk and to test various risk sharing approaches to mitigate the risks.
Calculating target allocations for practices is also a challenge because of constant changes to the practice registered population, particularly in areas with high population turnover such as inner cities. Across England as a whole, on average 9% of people move practices in a year, and in some urban areas and small practices this proportion is much higher.20 This population turnover is unlikely to be a large problem if there is little impact on overall health needs of the population. Our pragmatic solution was to calculate for each unique practice an average “needs weighting” for specific age and sex groups. This would allow a primary care group to assign an average needs weight for each new patient according to their age-sex group, and thus account for important changes in list size, either during the year or retrospectively at the end of the budget year. Furthermore, in some trusts new general practices will form. In this case age-sex group averages for the need variables cannot be calculated for the individuals in the new practice population using the PBRA formula. One solution for the first two years would be to use the trust age-sex group averages or the averages of a set of local practices that are thought to have similar patient characteristics.
Limitations of study
Although our approach to developing a resource allocation model is an advance on previous approaches, it relies on the same basic methodology, which assumes that the healthcare costs of individuals can be modelled empirically as a function of indicators of health needs and the supply of health services. Over the past three decades there has been continuing debate about whether this is a valid approach.7 8 The basic criticism is that relying on NHS data (on the costs of healthcare) to determine health need is inadequate because it fails to capture health needs that are not met by the NHS (for example, people with complex health needs living in nursing homes) if the individuals concerned do not use inpatient or outpatient care, possibly leading to lower allocations to populations with unmet needs.
This challenge is fair, but to some extent this study seeks to address the absence of direct individual level needs data by using diagnostic information. However, we acknowledge the reliance on hospital diagnosis means that this is incomplete and needs extension to non-hospital settings. The individual level diagnostic data do, however, represent an advance on the proxy area based data used hitherto, typically in the form of indicators of social deprivation. The key unanswerable question is whether individual level information or area based information better reflect health needs at practice level?
Another potential reason for the formula to reduce reliance on hospital based diagnoses is to reduce perverse incentives. For example, hospitals recording more diagnoses might reward local payers (general practices) with higher budgets. But general practices that have worked harder to reduce avoidable admissions than other practices in the primary care trust might find themselves awarded with a smaller budget since only diagnoses recorded in a hospital setting count in the formula. It was in part because of perverse incentives that we did not use in the formula variables denoting the number of times a person had been admitted as an inpatient, or attending a clinic as an outpatient under the NHS. Although these could indicate need for healthcare, and be highly predictive of future costs, our concern was that including such variables in a resource allocation formula might reward practices for referring patients to hospital or for hospitals to oversupply care. Furthermore, these variables may partly reflect variations in the accessibility and quality of NHS funded primary and secondary care (that is, supply factors) rather than health need. For these reasons, these “prior use of NHS funded care” variables have been excluded from similar resource allocation formulas internationally.
Increasing the availability of diagnostic data from non-hospital services is thus an urgent priority in order to enhance the information on individual level health needs within a PBRA model and reduce perverse incentives. It might also be worth investigating the value of using self reported health status of individuals in the PBRA model—whether the associated improvement in predictions would justify the cost of collecting these data across the entire population is an important research question.
While extensive data checks were undertaken, our models depended on routinely collected electronic data in the NHS, the quality of which has been questioned, particularly by clinicians. Hospital episode statistics inpatient data have been available from 1989-90 onwards from the NHS Information Centre. The Information Centre generates routine reports on data quality, which show ongoing improvements in data quality and coverage.28 Furthermore, in modelling across large sample populations, we found repeatedly consistent statistical relationships between variables, suggesting that the data are robust enough for the use intended.
The formula incorporated a variable for whether a person had a privately funded inpatient episode of care provided by the NHS in the previous two years: this had a negative impact on costs as expected. However, no data were available on the use of privately funded inpatient care provided by non-NHS providers to patients registered with GP practices in England. This information would have been valuable, but it could not be tested or incorporated in the formula. The negative impact of use of privately funded care on NHS costs means that practices with registered patients who used privately funded inpatient care in NHS facilities will have a lower target allocation than practices whose patients do not (all other things being equal). This is intuitively correct, as demands on the NHS budget for inpatient care will be lower in the former practices.
Wider considerations
It is important that general practices understand how a fair resource allocation formula is constructed if they are to accept budgets for commissioning as described. But two related issues are arguably more relevant for practices.
The first is list inflation. The current method of allocating resources for commissioning from the Department of Health to primary care trusts (using the CARAN formula) largely relies on area based population data from the census. But the trusts are due to be abolished from 2014 and replaced by clinical commissioning groups made up of practice based populations. Resource allocation therefore will be more reliant on accurate population data from practice registrations, and, since clinical commissioning groups will not cover populations defined by census defined areas, it will be more difficult to compare the accuracy of practice lists against census population estimates. Robust external audit of practice lists should be strengthened, particularly in areas with high population turnover (such as London).
The second issue is the pace of change of moving to “target” allocations. Some practices will have a considerable gap between their needs based target allocation and their current expenditure, and primary care trusts (clinical commissioning groups in future) will need to decide on how rapidly practice budgets should move to the target allocation from historical expenditure. This is likely to be the most important local judgment to be made when setting actual practice budgets.
Finally, there is no perfect formula, mainly because of the inability to measure health needs directly, and thus methods of resource allocation based on need will always be contested. The alternative of basing budgets for commissioning practices on historical spend would perpetuate historical inequities. The formula developed in this paper is an advance on previous methods and could help primary care trusts (clinical commissioning groups in future) base budgets for practices more strongly on the target allocations it produces. Further development of the PBRA statistical model has taken place to calculate target allocations for 2012-13, and will be reported shortly.
Conclusion
Using data derived mainly from the NHS, we have developed a good model for resource allocation to general practices for commissioning which incorporated person based information on health needs (diagnoses recorded on admission to hospital). The model performed in line with best international standards in predicting future health costs, predicting upwards of 77% of next year’s hospital costs per practice. Since the best models tested could predict only 12% of variation in next year’s costs at individual level, the models should be used only to guide allocations to practices, and are not recommended to be used at individual level.
Using this model alone, and without excluding specialised services or high cost patients, we would expect about a third of practices to exceed or undershoot predicted costs by more than 10%. Further empirical analysis is needed in this area, and the PBRA model should thus be combined with effective arrangements for sharing financial risk across the NHS.
What is already known on this topic
Formulas used to set target allocations to general practices for commissioning on the basis of need (rather than historical spending) have had to rely heavily on census data to identify health needs
These formulas have not been sensitive enough to predict future costs of an individual general practice’s population and thus base a practice budget on
What this study adds
A new formula, which used much more person based NHS data (diagnoses) to identify health needs, predicted 77% of the variation in the next year’s costs of a practice population
This formula can be used to guide more strongly allocations to commissioning practices and thus clinical commissioning groups
Notes
Cite this as: BMJ 2011;343:d6608
Footnotes
We thank Elizabeth Eastmure for her help in project management; Rob Shaw at the Department of Health, the Technical Advisory Group, and the Advisory Committee on Resource Allocation to the Department of Health for useful comments and suggestions on the analysis; Adam Steventon for help with analysis of data on immigrants and on accuracy of NHS numbers; Paul Dixon for costing the hospital episode statistics data and supplying area level supply and needs variables; Matt Sutton and Steve Morris for advice and access to sets of variables used in the development of earlier models; Philip Nicholson at the NHS Strategic Tracing Service, Susan Milner and Louise Dunn at the NHS Information Centre, and Melanie Kingston at the Patient Information Advisory Group (now National Information Governance Board) for help in supplying the data and encrypting unique fields; Perviz Asaria for help in an earlier feasibility phase of this project, in particular to obtain and link the required data; and Jonathan Low at Northgate-IS for assistance with preparing the hospital episode statistics data.
Contributors: JD was overall project lead, managing the study, contributing to ideas for analysis and interpretation, and writing this paper, and is guarantor for the study. PS was advisor, contributing ideas for modelling and other analysis and its interpretation, and helping to write this paper. HG led the development of the modelling, devising methods to calculate allocations for practices, and writing up the analysis. SM carried out most of the modelling. MB led the team undertaking some preliminary analysis of the modelling data, sourcing information, conducted sensitivity analysis of derived results, and advised on the overall modelling. NR advised on the empirical strategy and interpretation of results and carried out some of the preliminary modelling. TG helped to obtain the relevant datasets and carried out preparatory analysis of some of the data. MD helped in the modelling and in obtaining the datasets and variables for analysis, and assisted with checking the quality of the data. JB contributed ideas for analysis and its interpretation, and carried out some analysis related to the overall modelling. MDL contributed ideas and carried out some analysis related to the overall modelling. CS contributed ideas for analysis and its interpretation, and carried out some analysis related to the overall modelling.
All authors had full access to the data (including statistical reports and tables) in the study and can take responsibility for the integrity of the data and the accuracy of the data analysis.
Funding: The study was entirely funded by a grant from the Department of Health commissioned by the NHS Commissioning Arm of the DoH.
Another part of the DoH, the Advisory Committee on Resource Allocation, gave comments on the analysis and interpretation for the authors’ consideration, but the DoH had no role in deciding if this paper should be published, and the researchers are independent of the sponsoring body.
Competing interests: All authors have completed the Unified Competing Interest form at www.icmje.org/coi_disclosure.pdf (available on request from the corresponding author) and declare that NR, HG and CS were members of the Department of Health’s Advisory Committee on Resource Allocation during the period of the analysis. There were no other financial or non-financial conflicts of interests reported by any author.
Ethical approval: None required. Permissions to use the anonymised datasets were obtained from the Data Management Subgroup of the Ethics and Confidentiality Committee of the National Information Governance Board (www.nigb.nhs.uk/ecc).
Data sharing: No additional data available.
This is an open-access article distributed under the terms of the Creative Commons Attribution Non-commercial License, which permits use, distribution, and reproduction in any medium, provided the original work is properly cited, the use is non commercial and is otherwise in compliance with the license. See: http://creativecommons.org/licenses/by-nc/2.0/ and http://creativecommons.org/licenses/by-nc/2.0/legalcode.