Article Text

Abstract
Background and purpose Since 2001, symptom cluster research has grown considerably. However, because multiple methodological considerations remain, ongoing synthesis of the literature is needed to identify gaps in this area of symptom science. This systematic review evaluated the progress in symptom clusters research in adults receiving primary or adjuvant chemotherapy since 2016.
Methods Eligible studies were published in English between 1 January 2017 and 17 May 2021; evaluated for and identified symptom clusters ‘de novo;’ and included only adults being treated with primary or adjuvant chemotherapy. Studies were excluded if patients had advanced cancer or were receiving palliative chemotherapy; symptoms were measured after treatment; symptom clusters were pre-specified or a patient-centred analytic approach was used. For each study, symptom instrument(s); statistical methods and symptom dimension(s) used to create the clusters; whether symptoms were allowed to load on more than one factor; method used to assess for stability of symptom clusters and associations with secondary outcomes and biomarkers were extracted.
Results Twenty-three studies were included. Memorial Symptom Assessment Scale was the most common instrument and exploratory factor analysis was the most common statistical method used to identify symptom clusters. Psychological, gastrointestinal, and nutritional clusters were the most commonly identified clusters. Only the psychological cluster remained relatively stable over time. Only five studies evaluated for secondary outcomes.
Discussion While symptom cluster research has evolved, clear criteria to evaluate the stability of symptom clusters and standardised nomenclature for naming clusters are needed. Additional research is needed to evaluate the biological mechanism(s) for symptom clusters.
PROSPERO registration number CRD42021240216.
- cancer
- symptoms and symptom management
- supportive care
Data availability statement
Data sharing not applicable as no data sets generated and/or analysed for this study. Not applicable.
Statistics from Altmetric.com
Key messages
What was already known?
Gastrointestinal and psychological clusters are common.
What are the new findings?
Nutritional cluster was commonly identified.
What is their significance?
Clinical
Psychological clusters are relatively stable over time.
Gastrointestinal clusters appear to fluctuate over time.
Research
Standardised nomenclature for symptom clusters is needed.
Evaluation of biological mechanisms for symptom clusters is needed.
Introduction
As the incidence of new cancer cases and mortality rates increase globally,1 the symptom burden of oncology patients remains high. For example, in one study,2 50% of patients receiving chemotherapy experienced an average of 13 symptoms. Equally important, co-occurring symptoms and/or symptom clusters result in increased distress,3 decreased functional status,4 poorer quality of life (QOL)5 and increased mortality.6 7 Given that 50% of oncology patients may experience these negative effects, research on how and why symptoms co-occur is vital to the development of effective interventions.
In 2001, Dodd and colleagues8 were the first to introduce the concept of a symptom cluster into oncology symptom science. Since then, symptom cluster research has increased dramatically.9–12 While the definition of a symptom cluster has evolved,8 13 most recently, it was defined as the co-occurrence of two or more symptoms that are stable and independent of other clusters, and may share underlying mechanisms and/or outcomes.9 This research has grown to include the identification of symptom clusters in children14 and adolescents15; in patients with advanced cancer;16 17 and in patients receiving active treatment.11 An emerging area of research is the evaluation of biomarkers18 and molecular mechanisms19–21 associated with symptom clusters.
While this research provides important foundations in our understanding of cancer-related symptom clusters, two key methodological issues remain unresolved; namely: which statistical approach provides the most consistent identification of symptom clusters (eg, cluster analysis, exploratory factor analysis (EFA)) and how the dimension(s) of the symptom experience that are used to create the clusters (ie, occurrence, severity, frequency, distress) influence the number and types of symptom clusters identified. Resolution of these issues is key to the development of effective interventions for symptom clusters.9 In addition, consistent identification of symptom clusters will facilitate the investigation of their underlying mechanisms.
While Skerman and colleagues suggested that factor analysis methods were the optimal approach to create symptom clusters,22 cluster analysis23 and more recently network analysis (NA)24 have been used. Factor analysis methods, like EFA, are used to identify latent constructs or factors (ie, symptom clusters) that account for the strength of the relationships between variables (ie, symptoms).25 This type of factor analysis is exploratory in nature as it does not test hypotheses on the nature of the relationships among the variables. Cluster analysis methods (eg, hierarchical cluster analysis (HCA)), use measures of correlation or distance to group related variables (ie, symptoms).22 An emerging analytical approach for identifying symptom clusters is NA. With this approach, relationships between multiple variables or nodes (ie, symptoms) are quantified and illustrated graphically.26 Unique strengths of NA are its potential to identify ‘core’ symptoms (ie, symptoms that have a high impact on the network or cluster) and relationships among symptom clusters.27–29
Consensus is lacking on which dimension(s) (ie, occurrence, severity, frequency, distress) of the symptom experience should be used to identify symptom clusters.9 For example, in one review,11 a significant amount of variability was found in the dimensions used to identify symptom clusters. This type of evaluation is important because the specific dimension used may influence the number, types and composition of the symptom clusters that are identified, making comparisons across studies difficult. While each symptom dimension provides unique information, little is known about how the symptom clusters identified using different dimensions may affect various patient outcomes or the mechanisms that underlie various symptom clusters.
In the most recent review of symptom clusters research in oncology patients receiving chemotherapy,11 findings from studies published between 2000 and 2016 were synthesised. However, the impact of symptom clusters on outcomes (eg, QOL, functional status) and associations with underlying mechanisms were not evaluated. As noted in an expert panel report,9 ongoing synthesis of symptom clusters research is warranted to identify gaps in this area of scientific inquiry. Therefore, the purpose of this systematic review was to evaluate the progress in symptom clusters research in adult patients receiving primary or adjuvant chemotherapy since 2016. Specifically, this paper will: (1) describe the most common instrument(s), statistical approaches and symptom dimensions used to evaluate symptom clusters; (2) describe the number and types of symptom clusters identified using different dimensions of the symptom experience; (3) determine whether symptom clusters change over time; and (4) describe associations between symptom clusters and patient-reported outcomes (PROs) and biological mechanisms.
Methods
Search strategy
This review was performed using the Preferred Reporting Items for Systematic Reviews and Meta-Analyses guidelines.30 Studies that were published between 1 January 2017 and 17 May 2021 were retrieved from the Cochrane Library, Cumulative Index to Nursing and Allied Health Literature, Embase, PubMed and Web of Science databases. The search strategy for each database is listed in table 1.
Summary of search strategy
Study selection
Identified studies were downloaded into a prespecified Endnote Library for review and duplicates were removed. Studies were retained for review if they met the following eligibility criteria: (1) evaluated for and identified at least one symptom cluster; (2) included only adults (aged ≥18 years); (3) included only oncology patients who were being treated with primary or adjuvant chemotherapy; (4) were published in English; (5) had a cohort, case–control, cross-sectional or longitudinal design; and (6) identified symptom clusters ‘de novo’ (ie, used a statistical method to identify clusters). Studies were excluded if they: (1) were published prior to 1 January 2017; (2) included patients with advanced cancer (ie, stage IV) or those receiving palliative chemotherapy; (3) measured symptoms after the completion of treatment; (4) used pre-specified symptom clusters (ie, did not use a statistical method to identify clusters); (5) used a patient-centred analytic approach (eg, latent class analysis); or (6) were a systematic review, meta-analysis, conference abstract, dissertation work, case-report or qualitative study. The title and abstract of each study were reviewed by a single author (CSH) for eligibility based on our prespecified inclusion and exclusion criteria. The first (CSH) and senior (CAM) authors reviewed the full text of the remaining articles against the inclusion and exclusion criteria.
Data extraction
The prespecified study characteristics that were extracted are detailed in box 1. Separate evaluations were done for cross-sectional (online supplemental table 1) and longitudinal (online supplemental table 2) studies. Two reviewers (CSH and CAM) independently reviewed each study and consensus was reached on the data included in the tables.
Supplemental material
Supplemental material
Pre-specified study characteristics for extraction
Study characteristics: author(s), year published, purpose(s), study design, country, sample size
Patient characteristics: age, gender, ethnicity, race, employment status, inpatient/outpatient status, cancer diagnosis, cancer treatment, timing of symptom assessment(s)
Methods: symptom instrument(s), statistical methods used to create the clusters, symptom dimension(s), whether symptoms were allowed to load on more than one factor and method used to assess for stability of symptom clusters
Associations with other patient-reported outcomes (PROs) and biomarkers
Study findings: symptom clusters identified, specific symptoms within each cluster, PROs, biomarkers
Strengths and limitations
Assessment of methodological quality
Each study’s methodological quality was assessed using the National Heart, Lung, and Blood Institute’s (NHLBI) National Institute of Health Quality Assessment Tool for Observational and Cross-Sectional Studies.31 Questions on this tool were designed to enable researchers to critically appraise the internal validity of research studies. Each question is answered with ‘yes’, ‘no’ or ‘cannot determine, not reported or not applicable’. Items that receive a ‘no’ or indeterminable response are considered a study weakness that may introduce bias. As recommended by the NHLBI tool guidelines, this potential risk of bias must be further evaluated by a reviewer and is factored into the final rating of ‘good’, ‘fair’ or ‘poor’. Two reviewers (CSH and CAM) independently assessed the quality of each study and combined their results in a shared Excel spreadsheet. All studies that met the inclusion and exclusion criteria were included in this review regardless of the methodological quality assessment rating.
Results
Study selection
The initial search resulted in 574 articles. Following the removal of duplicates, 319 articles remained. Next, the title and abstract of each study were reviewed against our inclusion and exclusion criteria and 283 studies were excluded. The first (CSH) and senior (CAM) authors reviewed the full text of the remaining 36 articles against the inclusion and exclusion criteria. Following these steps, 23 articles were retained for data extraction and are included in this systematic review (figure 1).
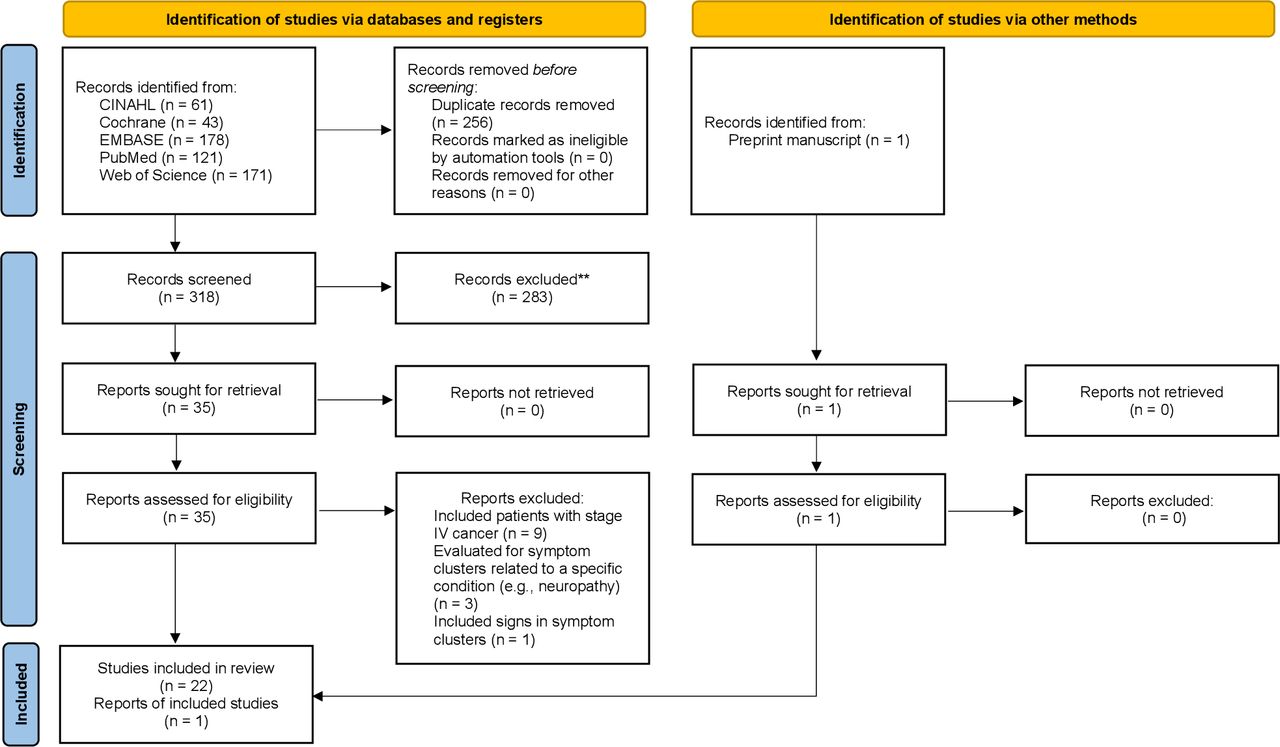
Preferred Reporting Items for Systematic Reviews and Meta-Analysis (PRISMA) flow diagram to determine the final selection of studies that evaluated for symptom clusters in patients receiving adjuvant chemotherapy, 2017–2021. From Page et al.30
Methodological quality of studies
Nine of the 13 cross-sectional studies received a ‘good’ quality rating, four received a ‘fair’ rating and none received a poor rating (table 2). Across the four studies that received a ‘fair’ rating, two sources of bias were: lack of reporting of whether the participation rate of eligible persons was at least 50% (item 3) and lack of clarity on whether the timing of the symptom assessment around the receipt of chemotherapy was sufficient in order to see an effect (item 7). All of the longitudinal studies received a ‘good’ rating. Of note, seven of the 10 longitudinal studies either lost >20% of patients to follow-up or did not report this information.
Quality assessment by the National Heart, Lung, and Blood Institute (NHLBI) of the National Institute of Health Quality Assessment Tool for Observational and Cross-sectional Studies
Cross-sectional study results
Study characteristics
Of the 23 studies included in this review, 13 used a cross-sectional design to identify symptom clusters in oncology patients receiving chemotherapy (online supplemental table 1). Seven studies were conducted in the USA,29 32–37 two in China,38 39 two in Thailand,40 41 one in Austria,42 and one in Turkey.43 Sample sizes ranged from 9641 to 1328.29 Across these studies, the majority of patients were female (weighted grand mean 76.8%), outpatients, not working, had a weighted grand mean age of 55.0 years, and were relatively homogeneous in terms of ethnicity and race.
Five studies evaluated for symptom clusters in patients with heterogeneous types of cancer.29 32 33 35 42 Of the eight studies that evaluated for clusters in patients with homogeneous types of cancer, four evaluated patients with breast cancer,34 36 40 41 one with bladder cancer,39 one with leukaemia,38 one with lymphoma,43 and one with lung cancer.37
Symptom instrument(s)
In terms of the instruments, nine of the 13 studies used the Memorial Symptom Assessment Scale (MSAS).29 32 33 35–38 40 43 Of these nine studies, six used a modified version of the MSAS29 32 33 35–37 and one used a condensed version.38 One study used multiple symptom assessment tools to assess for clusters;34 specifically, the Breast Cancer Prevention Trial Symptom Checklist, the Beck Depression Inventory-II, the Brief Pain Inventory, the Patient’s Assessment of Own Functioning, and the Profile of Mood States. One study each used the Edmonton Symptom Assessment Scale,41 the MD Anderson Symptom Inventory (MDASI),39 and the Rotterdam Symptom Checklist.42
Statistical approach
Nine of the 13 studies used EFA to identify symptom clusters.32–37 39 41 42 Of the remaining studies, two used principal component analysis (PCA),38 40 one used HCA43 and one used NA.29
Symptom dimension(s)
In terms of the symptom dimension(s), three of the 13 studies used only severity34 39 41 and three used only distress.32 38 42 Of the seven remaining studies, two used both occurrence and severity;36 37 one used severity and distress;40 one used frequency, severity and distress;43 and three used occurrence, severity, and distress.29 33 35
Occurrence
Across the five studies that used occurrence,29 33 35–37 a psychological cluster was identified. The number of symptoms ranged from five to 12. Worrying, feeling nervous, feeling sad, and feeling irritable were common across the five studies. A respiratory or lung cancer-specific cluster was identified across three of the five studies.29 35 37 The number of symptoms ranged from four to nine. Shortness of breath, difficulty breathing and cough were common across the three studies.
A nutritional or weight change cluster was identified across all five studies.29 33 35–37 The number of symptoms ranged from two to seven. While no common symptoms were identified across the five studies, increased appetite,29 33 35 37 weight gain,29 33 35 37 and weight loss29 35–37 were found in four of them. A gastrointestinal cluster was identified in three studies.33 35 36 However, no common symptoms were identified across the three studies.
Severity
Ten studies used severity to evaluate for clusters.29 33–37 39–41 43 Of the eight studies that named the clusters, all identified a psychological cluster (ie, emotion-related, psychological, psycho-urinary).29 33–37 39 40 The number of symptoms ranged from two to nine. Feeling sad, sadness, or depression was the only symptom that was identified across all of the studies.
Six studies identified a cluster related to nutritional status or weight (ie, nutritional, weight, weight change).29 33–37 The number of symptoms ranged from two to six. While no symptoms were common across all six studies, weight loss29 34–37 and weight gain29 33 35–37 were each identified in five of them.
A gastrointestinal or gastrointestinal and energy related cluster was identified in five of the eight studies.33 34 36 39 40 The number of symptoms ranged from two to eight. While no symptoms were common across all of the studies, nausea was identified in four of the five studies.33 34 39 40
Distress
Eight studies evaluated for clusters using the distress dimension.29 32 33 35 38 40 42 43 Similar to occurrence and severity, a type of psychological cluster (ie, anxiety and depression, emotion, energy and pain related, emotions, psychological, psychological/gastrointestinal) was identified in seven of the studies that named the clusters.29 32 33 35 38 40 42 The symptoms within this cluster ranged from three to 12. Feeling nervous or anxious and feeling sad or depressed mood were common symptoms across all seven studies.
Five studies identified a type of nutritional cluster (ie, appetite, nutritional, nutrition impaired, weight change).29 32 33 35 38 The symptoms ranged from two to seven. Lack of appetite was common across four of the five studies.29 32 35 38
Multiple dimensions
Seven studies evaluated for differences in clusters across two or more symptom dimensions.29 33 35–37 40 43 Of the six studies that named the clusters,29 33 35–37 40 a type of psychological cluster (ie, emotion related, emotion, energy and pain related, psychological/gastrointestinal, psychological) was common across all six studies and dimensions. Feeling irritable, feeling nervous, feeling sad, and worrying were the common symptoms across the six studies and dimensions.
A type of nutritional cluster (ie, nutritional, image and nutrition, discomfort and nutrition, weight change) was identified across all six studies and dimensions. Weight loss was the common symptom across all symptom dimensions in five of the six studies.29 35–37 40
Evaluation of the stability of symptom clusters across symptom dimensions
Of the six studies that named the clusters and evaluated for clusters using two or more dimensions,29 33 35–37 40 all of them evaluated the stability of the clusters across dimensions. Five studies33 35–37 40 used the method described by Kirkova and Walsh.44 The sixth study29 evaluated for stability through visualisation of differences in the network’s structures.
Analysis of secondary outcomes
In the four studies that evaluated for associations between clusters and other PROs,32 38 39 42 all of them used QOL. In addition, one evaluated for associations with patients’ functional status.38 None of the cross-sectional studies evaluated for associations between symptom clusters and biological mechanisms.
Longitudinal study results
Study characteristics
Of the 23 studies included in this review, 10 used a longitudinal design to evaluate for symptom clusters in oncology patients receiving chemotherapy (online supplemental table 2). Six studies were conducted in the USA,45–50 two in Sweden,51 52 one in China,53 and one in South Korea.54 Sample sizes ranged from 5154 to 540.50 Across these studies, the majority of the patients were female (weighted grand mean 84.4%), currently employed, had a weighted grand mean age of 55.1 years, and were relatively homogeneous in terms of ethnicity and race.
Only one study evaluated for symptom clusters in a sample of patients with heterogeneous cancer diagnoses.47 Of the nine studies that evaluated for clusters in patients with homogeneous diagnoses, six evaluated patients with breast cancer,45 46 48 50–52 one with acute myelogenous leukaemia,53 one with brain cancer,54 and one with lung cancer.49
Symptom instrument(s)
In terms of the instruments, seven of the 10 studies used the MSAS.47 49–54 Of these seven studies, three used a modified version of the MSAS.47 49 50 Two studies used the Hospital Anxiety and Depression Scale, the Symptom Experience Scale, and the Medical Outcomes Study Short-Form Survey v2.45 46 One study used the Breast Cancer Prevention Trial Symptom Checklist, the Beck Depression Inventory-II, the Brief Pain Inventory, the Patient’s Assessment of Own Functioning, and the Profile of Mood States.48
Statistical approach
In terms of the statistical methods, eight of the 10 studies used EFA.45–50 53 54 The remaining two studies used PCA.51 52
Symptom dimension(s)
In terms of the symptom dimension(s), four studies used only the severity dimension.45 46 48 54 While two studies evaluated for clusters using both occurrence and severity,49 50 two used occurrence, severity, and distress.47 53 The remaining two studies created a symptom burden score (ie, the average of the frequency, severity, and distress scores for each symptom on the MSAS).51 52
Occurrence
Four studies used occurrence to identify clusters across three timepoints.47 49 50 53 For three of these studies,47 49 50 these timepoints were: approximately one week before the second or third cycle of chemotherapy (T1), approximately one week after chemotherapy administration (T2), and approximately two weeks after chemotherapy administration (T3). For the fourth study,53 these timepoints were: within six days of the start of induction chemotherapy (T1a), one to seven days during induction chemotherapy (T2a), and one to seven days after induction chemotherapy (T3a).
A psychological cluster was identified across all four studies and all three timepoints, except for one study where the cluster was not identified until T2a.53 Feeling nervous and feeling sad were common across each study and timepoint. In addition, difficulty concentrating, feeling irritable, and worrying were common to the three studies that identified a psychological cluster at T1.47 49 50 Across these four studies, the symptoms within this cluster remained relatively consistent across time.
While a nutritional or weight change cluster was identified across all four studies, it was not identified at each timepoint. For three of the studies,47 49 50 lack of appetite was present at T2 and lack of appetite and weight gain were present at T3. Except for one study,53 the symptoms identified within this cluster were relatively consistent across timepoints within each study.
While an epithelial, epithelial/gastrointestinal, or body image cluster was identified across all four studies, it was not identified at each timepoint and the symptoms within this cluster changed over time. Hair loss was identified at T2 in three studies.47 49 50 Itching was identified at T3 and T3a in three studies.47 50 53 Changes in skin was identified across all four studies at T3 and T3a.47 49 50 53
A gastrointestinal cluster was identified across three studies at one or more timepoints.47 50 53 However, this cluster was not identified at each timepoint and no common symptoms were consistent across each of the three studies. Abdominal cramps appeared across two of the studies that identified this cluster at T1.47 50
Severity
Eight studies used severity to identify clusters across three or four timepoints.45–50 53 54 Of the two studies that evaluated for clusters over four timepoints, one evaluated for clusters throughout all cycles of chemotherapy (ie, prior to the first cycle to post-chemotherapy)45 and the other evaluated for clusters from prior to and at 18 months post-chemotherapy.48 Five of the remaining six studies evaluated for clusters over three timepoints around the receipt of active treatment (eg, prior to and post-chemotherapy).47 49 50 53 54 The sixth study evaluated for clusters after the completion of chemotherapy (ie, prior to chemotherapy to one year after initial chemotherapy treatment).46
While no single cluster was common across the eight studies, a gastrointestinal cluster was identified across seven of them.45–48 50 53 54 This cluster was not identified across all timepoints and no common symptoms were identified. In addition, a type of psychological cluster (ie, negative emotion, negative emotion and decreased vitality, psychological, psychoneurocognitive) was identified in six of the eight studies.47–50 53 54 This cluster was not identified across all of the timepoints. However, when the cluster was identified, feeling sad or depression was consistent across all of the studies.
Distress
Only two studies evaluated for clusters using distress across three timepoints.47 53 A psychological cluster was identified across both studies and at two of the three timepoints. Across these timepoints, feeling nervous and feeling sad were consistent. While an epithelial or body image cluster was identified across both studies, it was not present across all three timepoints. When the cluster did occur, itching was identified across both studies and timepoints.
Burden score
In the two studies that used a symptom burden score to identify clusters, one evaluated for clusters over four timepoints across multiple cycles of chemotherapy51 and the other evaluated for clusters over three timepoints prior to the start of the second cycle of chemotherapy to 12 months post cycle two.52 An emotional cluster was identified across both studies and timepoints. Feeling sad was common across both studies and all timepoints. While a physical cluster was identified across both studies and timepoints, no common symptoms were identified.
Multiple dimensions
Four studies evaluated for clusters using two or more dimensions over three timepoints.47 49 50 53 In three of these studies,47 49 50 a psychological cluster was identified across all of these studies, dimensions and timepoints. In the fourth study,53 this cluster occurred with some variability across timepoints and dimensions. Feeling nervous and feeling sad occurred consistently across studies, dimensions, and timepoints.
While an epithelial, epithelial/gastrointestinal, or body image cluster was identified across all four studies, it was not stable across dimensions or timepoints. Only changes in skin appeared across dimensions and studies at the third timepoint (ie, two weeks postcycle two or three, one to seven days after induction).47 49 50 53 In addition, gastrointestinal and nutritional or weight change clusters were identified across three of the four studies.47 50 53 No common symptoms were identified consistently across studies, dimensions and/or timepoints for either cluster.
Evaluation of the stability of symptom clusters across symptom dimensions and/or timepoints
Six studies47–50 53 54 used the method described by Kirkova and Walsh44 to evaluate the stability of symptom clusters across dimensions and timepoints. Two studies45 46 relied on an investigator’s appraisal of the stability. The remaining two studies51 52 did not report on a method to evaluate stability.
Analysis of secondary outcome(s)
In the only longitudinal study that evaluated for associations between symptom clusters and a PRO,46 measures of QOL were used. In the only study that evaluated for associations between symptom clusters and biological mechanisms,54 levels of lipid peroxidation were examined in patients with primary brain tumours.
Discussion
This systematic review evaluated the progress of symptom clusters research in adult patients receiving primary or adjuvant chemotherapy from 2017 through 2021. Given the relative infancy of symptom cluster research, this type of ongoing review and synthesis is needed to advance this area of scientific inquiry. This discussion focuses on how the science has evolved since the previous review.11
Symptom assessment instruments
The MSAS was the most common instrument used in 69.6% of the studies. While it was found to be one of the most commonly used instruments in the previous review,11 its use grew from 26.3% to 69.6%. This growth may be due to the multiple strengths of the MSAS. First, because it evaluates 32 common symptoms, it is cited as one of the most comprehensive instruments to use in research and clinical practice.55 In addition, the MSAS evaluates multiple dimensions of the symptom experience (ie, occurrence, severity, frequency, distress); has well established validity and reliability;56 and is available in more than eight languages (eg, Arabic,57 Chinese,58 Spanish59).
In contrast with the previous review that noted that the MDASI was used in 26.3% of the studies,11 it was used in only 4.3% of the studies in this review. This change may be due to a shift among researchers to use more comprehensive symptom instruments. Instruments like the MDASI (13 symptoms) and the Edmonton Symptom Assessment Scale (nine symptoms) are limited because they assess a relatively small number of symptoms using only severity ratings. Given that oncology patients receiving active treatment report an average of 13 unrelieved symptoms,2 and the optimal symptom dimension to evaluate for symptom clusters has yet to be determined, use of a comprehensive, multidimensional instrument is warranted.
Statistical approaches
EFA was the most common method used in 73.9% of the studies,32–37 39 41 42 45–50 53 54 followed by PCA in 17.4%.38 40 51 52 These findings are consistent with the previous review that reported that 68.4% of the studies used a factor analytic approach.11 Given that one conceptual basis for the use of EFA is that symptoms cluster together because they share common underlying mechanism(s),22 60 EFA is preferred over HCA or PCA.
One of the key strengths of EFA is that it allows symptoms to load on more than one factor. As a result, the authors of the previous review recommended that the most common symptoms that load on more than one cluster be identified.11 Of the studies that used EFA, 10 allowed for symptoms to load on multiple factors.33 35–37 42 46 47 49 50 53 While the symptoms that loaded on more than one factor were not specified in most studies, in the two studies that evaluated for symptom clusters in patients with lung cancer,37 49 difficulty concentrating, feeling nervous, feeling sad, swelling of the arms and legs, and worrying cross-loaded on multiple clusters. For the four studies that evaluated for clusters in patients with breast cancer,36 46 50 53 change in the way food tastes cross-loaded in three studies36 50 53 and difficulty concentrating cross-loaded in two.46 53
Symptom dimensions
While severity was the most common dimension used to create the clusters (78.3%),29 33–37 39–41 43 45–50 53 54 43.5% used distress,29 32 33 35 38 40 42 43 47 53 39.1% used occurrence,29 33 35–37 47 49 50 53 8.7% used a burden score,51 52 and 4.3% used frequency.43 Only 47.8% of the studies evaluated for symptom clusters using two or more symptom dimensions.29 33 35–37 40 43 47 49 50 53
Among the 10 studies that evaluated for clusters using two or more dimensions and named the clusters,29 33 35–37 40 47 49 50 53 psychological and nutritional clusters were the two common clusters identified across all of the studies and dimensions. However, none of the symptoms within these clusters were consistent across studies. This finding may be partially explained by the variability in cancer diagnoses across the studies. In the previous review,11 the authors were unable to compare the number and types of clusters identified across dimensions due to the fact that only 15.8% (n=3) of the studies used two or more dimensions. The growth in the number of studies from 15.8% to 47.8% may be a result of multiple reports recommending that research be done on the stability of symptom clusters across the different dimensions.9–11
Number and types of symptom clusters
Across the 23 studies included in this review, the number of clusters identified ranged from two to eight. A psychological cluster was the most common cluster identified in 82.6% of the 23 studies in this review.29 32–40 42 47–54 Similar to the previous review,11 feeling sad or depressed was common across 18 of the 19 studies, while feeling anxious or nervous was common across 16.
Consistent with the previous review,11 a gastrointestinal cluster was another common cluster identified in 69.6% of the studies.29 33–36 39 40 42 45–48 50 51 53 54 Nausea was the most common symptom in this cluster that occurred in 13 of the 16 studies, followed by diarrhoea in eight. This finding is similar to the previous review11 that identified nausea as one of the most common symptoms across 10 of the 13 studies.
In a departure from the previous review that identified a nutrition or nutritional cluster in only 15.8% of the studies,11 a nutritional or weight change cluster was identified across 56.5% of the studies in this review.29 32–38 47–50 53 Lack of appetite was the most common symptom in 12 of the 13 studies,29 32 34–38 47–50 53 followed by weight loss in 11.29 34–38 47–50 53
The emergence of a nutritional or weight cluster may be due to the inclusion of an increased number of symptoms related to these two problems. For example, in nine of the 13 studies that identified a nutritional or weight change cluster, the MSAS was modified to include additional symptoms (eg, abdominal cramps, increased appetite, weight gain).29 32 33 35–37 47 49 50 Weight gain was common across nine studies29 33 35–37 47–50 and increased appetite was common across six.29 33 35 37 47 49 Additional research is needed to determine the optimal number, as well as the most common and disease and treatment-specific symptoms, to assess in order to obtain more specific and mechanistically based symptom clusters.
In factor analytic methods, factor loading scores are standardised partial regression coefficients that provide an estimate of the strength of the association between a variable (ie, symptom) and a factor (ie, symptom cluster) while controlling for the impact of other factors.25 This score is used to determine which symptoms load on which factors using a predetermined cut-off that indicates a meaningful relationship. While factor loadings of ≥0.30 or ≥0.40 are commonly accepted,61 it is not clear what the optimal minimum factor loading score should be to include a symptom within a cluster.
In this review, ≥0.40 was the most common minimum factor loading score (n=11),33 34 36–38 40 47–50 53 followed by ≥0.30 (n=3),35 45 46 and ≥0.50 (n=1).52 Of note, seven studies did not report this score. In the studies that used a minimum factor loading score of 0.40, two to eight symptom clusters were identified. While no clear pattern emerged in terms of sample size, this wide gap may be due to differences in the instruments used (eg, disease specific vs cancer specific); the type of treatment (eg, adjuvant vs induction chemotherapy); or the timing of the symptom assessments (eg, during chemotherapy, post-chemotherapy). Two of the three studies that used a factor loading of 0.30 identified only two clusters (n=219,45 n=21946) and the third identified five (n=232).35 This difference may be due to the fact that two of these studies45 46 used only 10 symptoms to evaluate for clusters.
Unique symptom clusters
While it is important to identify which clusters are consistent across cancer types and treatments, it is equally important to identify clusters that are unique to a specific cancer and/or treatment. A hormonal or vasomotor cluster was identified in 26.1% of the studies.29 34–36 48 50 Of note, four of these studies evaluated for clusters in women with breast cancer34 36 48 50 and one in women with a gynaecological cancer.35 In the sixth study,29 the majority of women had either breast (40.2%) or gynaecological cancer (17.3%)
Changes in symptom clusters over time
Ten studies evaluated for changes in clusters over three46 47 49 50 52–54 or four timepoints.45 48 51 While three studies evaluated for clusters beyond the completion of chemotherapy (eg, six months post-chemotherapy),46 48 52 the other seven studies evaluated for clusters around and during active treatment.45 47 49–51 53 54 Of these studies, six reported a psychological or emotional cluster that remained relatively stable over time.47–52 In contrast, six studies identified a gastrointestinal cluster that varied over time.45–48 51 53
Methods to evaluate the stability of symptom clusters across dimensions and/or over time
Stability was evaluated using the method proposed by Kirkova and Walsh44 in 81.1% of the studies that evaluated for differences in symptom clusters across two or more dimensions,33 35–37 40 47 49 50 53 and in 60% of the longitudinal studies47–50 53 54 that evaluated for the stability across dimensions and timepoints. The method proposed by Kirkova and Walsh44 specifies that 75% of the symptoms in a cluster should be in agreement in order for a symptom cluster to be stable across timepoints or dimensions. In addition, the most ‘prominent or important symptom(s)’ needs to be present.44 (p. 1012) While the majority of studies that evaluated for stability of symptom clusters across dimensions or time used Kirkova and Walsh’s method, the criteria were applied with relative subjectivity (eg, described clusters as ‘relatively stable’50 (p. 47); described symptoms within clusters as ‘relatively stable’53 (p. 787)).
This subjectivity may be due in part to a lack of clarity and consensus on the definition of ‘stability’. Similar to Kirkova and Walsh,44 in their definition of a symptom cluster, Kim and colleagues13 used stability as a characteristic to describe the group of symptoms within the cluster. In contrast, other researchers have described stability in terms of the type of cluster that is identified. Skerman and colleagues22 suggested that for a cluster to be stable, it must be ‘reproducible’ (ie, replicated in a similar sample) or appear reliably over time. Barsevick12 went further to describe stability as how consistently clusters appeared across statistical methods, within homogeneous populations, or over time. From these descriptions, it is unclear if stability refers to the the stability of a specific cluster itself (eg, gastrointestinal, nutritional) across time and/or symptom dimensions, or the symptoms within the cluster. Adding to this confusion, only one of these reports provided criteria to evaluate stability.44
Building on Barsevick’s description, we suggest that the term stability should be used to describe whether or not the same clusters are identified across study samples, dimensions and/or over time. While consistency should be used to describe whether the symptoms within a cluster remain the same across these conditions. The use of separate terms to describe these characteristics of symptom clusters may provide clarity and move the science forward. In addition, consensus on how stability is used in the definition of a symptom cluster research warrants consideration.
Secondary outcomes and biomarker evaluation
Of the five studies that evaluated for associations between symptom clusters and other PROs,32 38 39 42 46 all used measures of QOL. In addition, Chen and colleagues38 examined the relationships between symptom clusters and functional performance. Cherwin and Perkhounkova32 examined how symptom clusters impact symptom interference with daily life and QOL. Of the 23 studies included in this review, only one54 evaluated for associations between symptom clusters and a biological mechanism.
Limitations
Despite the strict criteria that were employed to ensure a comprehensive review of the literature, only one author made the initial study selection and only two authors did the data extraction. Therefore, it is possible that some studies and/or information were missed. Because the majority of the studies in this review included patients who were homogeneous in terms of gender, race, ethnicity, and cancer diagnosis, our findings may not generalise to all patients with cancer. In addition, because this review focused on adults with stage I to III cancer, our findings may not generalise to patients with advanced cancer or cancer survivors. Finally, 34.8% of the studies came from a single, large study of patients undergoing chemotherapy and may influence the findings of this review.
Conclusions
This review highlighted numerous areas of growth within symptom clusters research, and identified multiple areas that warrant consideration. One ongoing issue in symptom cluster research is the lack of consistent methods for naming the clusters. In 2016,10 Miaskowski stressed that a standardised nomenclature needed to be developed in order to facilitate comparisons of clusters across studies. However, as demonstrated in this review, a large amount of variability exists in how clusters were named. For example, the psychological cluster had 10 different names. In addition, researchers must name their clusters to allow for comparisons. In this review, symptom clusters were unnamed in 8.7% of the studies41 43 compared with 26.3% in the previous review.11
We identified only one study that evaluated for symptom clusters using NA.29 An advantage of NA is that it allows for an examination of the strengths of the relationships among the symptoms within a cluster and how symptom clusters relate to each other within the network. Additional research using NA is needed to explore the inter-relationships among symptoms within clusters and whether these relationships differ based on the dimension used.
One of the aims of this review was to describe associations between symptom clusters and biological mechanisms. Of the 23 studies included in this review, only one study evaluated for associations between symptom clusters and a biological mechanism.54 Investigation of the mechanisms that underlie symptoms and symptom clusters is a key priority set by the National Institute of Nursing Research.62 Future research needs to incorporate the evaluation of biological mechanisms that may underlie symptom clusters in order to better understand why these symptoms cluster and to develop interventions to target clusters of symptoms rather than single symptoms.
Data availability statement
Data sharing not applicable as no data sets generated and/or analysed for this study. Not applicable.
Ethics statements
Patient consent for publication
Ethics approval
This study does not involve human participants.
References
Supplementary materials
Supplementary Data
This web only file has been produced by the BMJ Publishing Group from an electronic file supplied by the author(s) and has not been edited for content.
Footnotes
Contributors CSH and CAM both contributed to conception and design; acquisition and analysis of the literature and drafted and critically revised the manuscript. KK contributed to conception and design; analysis of the literature and critically revised the manuscript. YC, AAD and MJH each contributed to the analysis of the literature and critically revised the manuscript. CSH is the guarantor of this work and accepts full responsibility for the work and/or the conduct of the study, had access to the data, and controlled the decision to publish. All authors gave final approval and agree to be accountable for all aspects of work ensuring integrity and accuracy.
Funding CSH is supported by a grant from the American Cancer Society (134336-DSCN-20-073-01-SCN) and the National Institute of Nursing Research of the National Institutes of Health (T32NR016920). CAM is an American Cancer Society Clinical Research Professor.
Disclaimer The content is solely the responsibility of the authors and does not necessarily represent the official views of the National Institutes of Health.
Competing interests None declared.
Provenance and peer review Not commissioned; externally peer reviewed.
Supplemental material This content has been supplied by the author(s). It has not been vetted by BMJ Publishing Group Limited (BMJ) and may not have been peer-reviewed. Any opinions or recommendations discussed are solely those of the author(s) and are not endorsed by BMJ. BMJ disclaims all liability and responsibility arising from any reliance placed on the content. Where the content includes any translated material, BMJ does not warrant the accuracy and reliability of the translations (including but not limited to local regulations, clinical guidelines, terminology, drug names and drug dosages), and is not responsible for any error and/or omissions arising from translation and adaptation or otherwise.