Article Text

Abstract
Background The annual incidence of euthanasia in the Netherlands as a percentage of all deaths rose from 1.9% in 1990 to 4.4% in 2017. Scarce literature on regional patterns calls for more detailed insight into the geographical variation in euthanasia and its possible explanations.
Objectives This paper (1) shows the geographical variation in the incidence of euthanasia over time (2013–2017); (2) identifies the associations with demographic, socioeconomic, preferential and health-related factors; and (3) shows the remaining variation after adjustment and discusses its meaning.
Design, setting and methods This cross-sectional study used national claims data, covering all healthcare claims during 12 months preceding the death of Dutch insured inhabitants who died between 2013 and 2017. From these claims all euthanasia procedures by general practitioners were selected (85% of all euthanasia cases). Rates were calculated and compared at three levels: 90 regions, 388 municipalities and 196 districts in the three largest Dutch cities. Data on possibly associated variables were retrieved from national data sets. Negative binomial regression analysis was performed to identify factors associated with geographical variation in euthanasia.
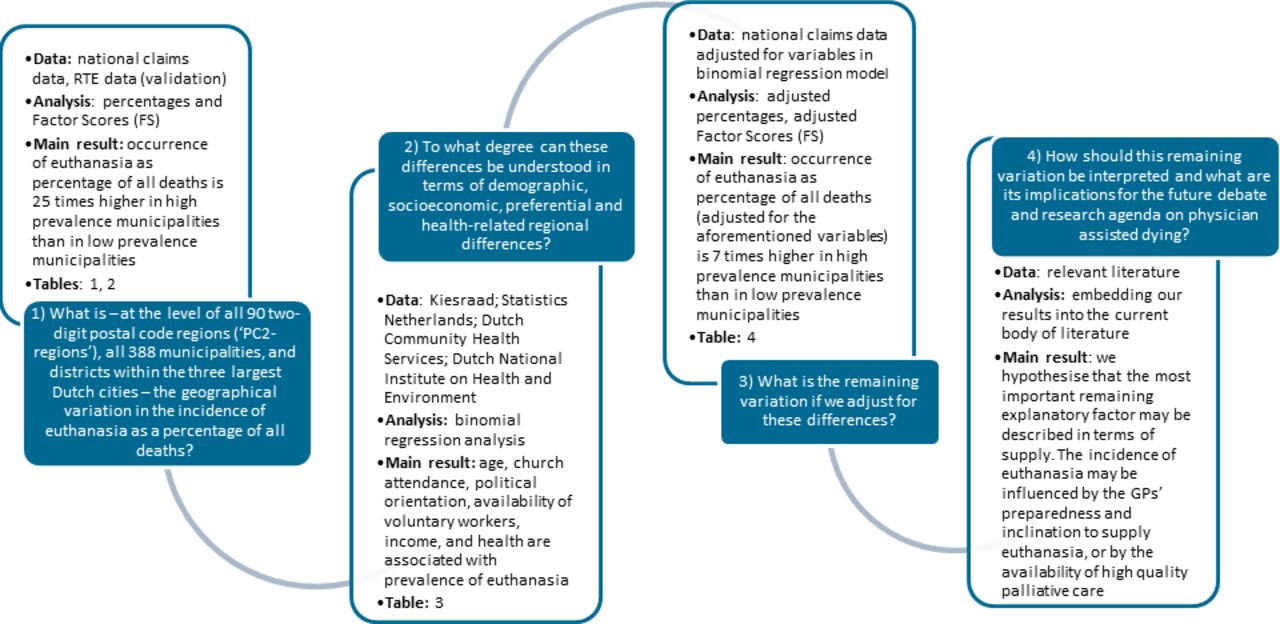
Results There is considerable variation in euthanasia ratio. Throughout the years (2013–2017) the ratio in the three municipalities with the highest incidence was 25 times higher than in the three municipalities with the lowest incidence. Associated factors are age, church attendance, political orientation, income, self-experienced health and availability of voluntary workers. After adjustment for these characteristics a considerable amount of geographical variation remains (factor score of 10), which calls for further exploration.
Conclusion The Netherlands, with 28 years of legal euthanasia, experiences large-scale unexplained geographical variation in the incidence of euthanasia. Other countries that have legalised physician-assisted dying or are in the process of doing so may encounter similar patterns. The unexplained part of the variation may include the possibility that part of the euthanasia practice may have to be understood in terms of underuse, overuse or misuse.
- end of life care
- quality of life
Data availability statement
Data are available upon reasonable request with the first author of the article. The results will be disseminated to both patient organisations (NVVE, NPV, Dutch Patient Federation), and physicians organisations (NHG, LHV, KNMG).
This is an open access article distributed in accordance with the Creative Commons Attribution Non Commercial (CC BY-NC 4.0) license, which permits others to distribute, remix, adapt, build upon this work non-commercially, and license their derivative works on different terms, provided the original work is properly cited, appropriate credit is given, any changes made indicated, and the use is non-commercial. See: http://creativecommons.org/licenses/by-nc/4.0/.
Statistics from Altmetric.com
Introduction
Background/rationale
The Netherlands was the first country in the world to legalise euthanasia and physician-assisted suicide (henceforth ‘euthanasia’), with an officially tolerated euthanasia practice since 1985, leading to a makeshift law in 1994 and a fully fledged euthanasia law in 2002.1 After a pause in the early 2000s the number of euthanasia cases has shown a continuous rise since 2006.2 From 1933 cases in 2005 the number of reported cases went up to 6361 in 2019.3 Alongside absolute numbers, the annual reports of the Regional Euthanasia Review Committees (RTEs) and the 5-yearly governmental evaluations present euthanasia ratios: euthanasia cases as a percentage of the total number of deaths per year. This rate increased from an estimated 1.9% of all deaths in 19904 5 to 4.2% in 2019.3 The 2017 annual report concludes: ‘the number of notifications of euthanasia has thus risen, but remains a relatively small proportion of the total number of deaths in the Netherlands’.6 However, since the percentage of 4.2 is a national average, percentages may vary across the country.
Geographical variation is a phenomenon that is common in healthcare. It has been extensively described in the literature for surgical care,7 medication prescription,8–10 use of radiological imaging11 and admission rates to the hospital.12–14 Geographical variation in those contexts is an issue, especially if it is unwarranted, which ‘implies that many patients are getting procedures they do not want or need’ (p1127).7 Supply-driven clinical practice runs the risk that medical opinions dominate what patients actually want. If unwarranted geographical variation in surgery, medication prescription, diagnostics and hospital admission is considered problematic, then geographical variation in euthanasia, given its invasive and irreversible nature, should be of concern as well. Experiences from the Netherlands may be relevant internationally. Countries with more recent or planned legislation in the field of medically assisted dying may in the future face similar geographical variations and may want to address the corresponding ethical, medical and societal questions. For example, Canadian figures from 2019 show a factor of 4.7 difference in the incidence of medical assistance in dying as a percentage of all deaths between the health authorities of Vancouver Coastal (7.1%) and Fraser Health (1.5%).15 16
To the best of our knowledge the current body of international literature on geographical variation in assisted dying consists of only one article. It explores differences in the euthanasia ratio between the five euthanasia regions in which the Netherlands is divided (1.7%–3.4%) and tries to explain these differences by demographic, socioeconomic, preferential and health-related differences between the regions.17 Due to data limitations this proved to be hard. Highly aggregated data were retrieved from the five RTEs, resulting in only five regions that could be compared. Data on a more detailed level could shed light on the extent and the backgrounds of geographical variation.18 In line with this, Koopman and Putter17 conclude that ‘more detailed research is needed to specify how and why the practice of [euthanasia and assisted suicide] differs between regions in the Netherlands and to what extent these differences reflect a deficiency in the quality of care, such as other forms of regional variation in health care practice’ (p387).
Objectives
The aim of this paper is to answer the following research questions: (1) What is—at the level of all 90 two-digit postal code regions (‘PC2-regions’), all 388 municipalities and districts within the three largest Dutch cities—the geographical variation in the incidence of euthanasia as a percentage of all deaths? (2) To what degree are these differences associated with demographic, socioeconomic, preferential and health-related regional differences? (3) What is the remaining variation if we adjust for these differences? (4) How should this remaining variation be interpreted and what are its implications for the future debate and research agenda on physician-assisted dying?
Methods
Design, setting and participants
This cross-sectional study includes all Dutch insured persons (which is 99.9% of the Dutch population19) deceased in one of the years 2013, 2014, 2015, 2016 or 2017. Since a vast majority (85%) of euthanasia cases are performed by general practitioners (GPs),20 and because no (claims) data exist on euthanasia performed by other physicians, we selected all GP activities with the product code ‘13038-euthanasia’ claimed for these patients somewhere during the 12 months preceding their deaths.
Data sources
Seven data sources were used: (1) information about euthanasia claims (all GP activities with the product code ‘13038-euthanasia’), patient’s age and gender, total number of deceased inhabitants and geographical information (two-digit postal code, municipality) were provided by Vektis. Vektis is a national data warehouse of all healthcare claims of all Dutch healthcare insurance companies.21 (2) We used national data on the prevalence of euthanasia from the RTEs for data validation. (3) Data on inhabitants’ political orientation were obtained from ‘De Kiesraad’.22 (4) Data on religion were retrieved from a research database by Statistics Netherlands (SN).23 (5) Data on suicide in 24 Dutch cities were obtained from another SN database.24 (6) Data on types of household, social insurance, income and distance to the nearest hospital were retrieved from ‘Core Figures on Districts’ by SN.25 (7) Data on loneliness,26 availability of informal care and voluntary workers,27 depression,28 functional,29 visual30 and auditive31 limitations, being ‘in control’ of one’s own life,32 and experienced physical condition33 were taken from a database shared by the Dutch Community Health Services, the Dutch National Institute on Health and Environment, and SN.
Variables
The total number of euthanasia cases claimed by GPs, as well as the total number of deaths, and sample characteristics (gender and age) were collected for each year at the level of PC2 regions, municipalities and municipal districts (ie, four-digit postal codes, PC4). The possible explanatory variables were only available at the municipal level, with one common year for all variables: 2017. These variables include gender; age groups (0–14, 15–24, 25–44, 45–64 and 65+ years old); the percentage of votes for political parties in the 2017 parliamentary elections, divided (with respect to ethical issues34) into conservative parties (CDA, ChristenUnie, SGP, DENK), middle parties (VVD, PVV, SP, 50plus, FvD) and liberal parties (D66, Groen Links, PvdA); the percentage of inhabitants who reported loneliness; the percentage of inhabitants who reported church attendance at least once per month; the percentage of inhabitants’ self-reported religious beliefs; the percentage of non-Western immigrants; the composition of households; the number of inhabitants who were on social welfare, unemployed or disabled from employment; the percentage of inhabitants who received informal care, who provided informal care and their self-perceived burden of providing this care; the percentage of inhabitants who state that they provide voluntary work (this encompasses caring activities, as well as other work, and thus indicates the degree of social cohesion, as well as the availability of (help from) social networks in municipalities); the percentage of inhabitants who felt depressed; the percentage of inhabitants with functional, physical, visual or auditory limitations; the percentage of inhabitants who had good self-management and who were in good health; the median income; and the distance to the nearest hospital. In addition, the incidence of suicide for 24 cities (numbers for smaller municipalities are not provided for privacy reasons) was collected. Two municipalities had missing values on the variables ‘percentage (…) receiving informal care’, ‘(…) burden of providing informal care’ and ‘distance to nearest hospital’. We imputed these missing values with the MICE package in R.35
Bias
In order to verify the validity of the number of euthanasia cases and of the number of deaths derived from the claims data, and to prevent any selection bias, we compared these figures with the number of euthanasia cases reported by the RTEs and the death statistics by SN, respectively (see the Limitations and generalisability section). Furthermore, since small area variation might easily be biased by small sample sizes,36 37 we used a threshold of a minimum of 100 deaths per year at the municipality level and a minimum of 50 deaths at the district level.
Statistical methods
First, euthanasia ratios were calculated per year and per region. At the level of (1) all 90 PC2 regions, (2) all 388 municipalities and (3) the districts of the three largest Dutch cities—Amsterdam (67 districts), Rotterdam (68 districts) and The Hague (61 districts)—the total number of euthanasia cases in each year was divided by the total number of deaths in that year and multiplied by 100.
In order to quantify the variation in euthanasia at the three levels (our first objective), the average percentage of euthanasia in the highest three regions with at least 100 deaths was divided by the average percentage of euthanasia in the lowest three regions with at least 100 deaths and at least 1 case of euthanasia. For the largest cities, the same calculation was performed for the highest three districts with at least 50 deaths, versus the lowest three districts with at least 50 deaths and at least 1 case of euthanasia. This yielded the so-called ‘factor score (FS)’. Although other measures have also been described to express geographical variation in healthcare utilisation (such as the systematic component of variation, IQR or SD), we chose this so-called ‘minimum/maximum approach’, which has been described in the literature as well38 and is currently used in several atlas projects.39 40 The ‘≥100/50 deaths thresholds’ were chosen in order to avoid bias from small sample variation. The threshold of ‘at least one euthanasia case’ was used to avoid denominators of ‘0’. We did however count the number of municipalities/districts with zero euthanasia cases because in terms of geographical variation it is relevant to know if a treatment does not occur at all in some regions. Following other geographical variation studies,41 and in order to adjust for outliers, we also calculated the so-called P95/P5 factor score by dividing the 95% percentile of the percentage of euthanasia by the 5% percentile of the percentage of euthanasia at all three levels.
To identify factors that are associated with variation (our second objective), we aggregated the euthanasia data of all years together (2013–2017). First we calculated crude factor scores for the entire period based on the lowest and highest areas. Second, a negative binomial regression analysis was performed on the multiple imputed data set (the ‘full model’). The number of euthanasia cases was used as the dependent variable, with the total number of deaths as the offset term, and all possible explanatory factors were used as independent variables. Next, we selected our final model (‘reduced model’) using those variables that were statistically significant. We also explored collinearity by calculating the variation inflation factor (two variables were excluded for that reason: ‘limitations in daily functioning’ and ‘household composition’). The data on the number of suicides in the 24 largest Dutch cities were not detailed enough to be included as a variable in the final model.
After obtaining the ‘reduced model’, we again calculated the amount of variation and explored whether part of the variation can be understood by means of the model (our third objective). Since geographical variation in euthanasia ratios is highest and most pronounced at the level of municipalities, and because data on possible explanatory variables are mostly available at that level, we aimed to understand regional variation at the level of municipalities. Of all 388 Dutch municipalities in our data, 42 had to be excluded due to lack of information of the possible explanatory variables. Other municipalities merged during the 5-year period for reasons of geographical reorganisation and were also excluded from the data set. After municipalities with ‘0’ euthanasia cases and <100 deaths were excluded, a final number of 326 municipalities remained for the main analysis. To calculate the ‘adjusted geographical variation score’ for these municipalities, and following earlier research on geographical variation,42 we divided its observed percentage of euthanasia cases by the calculated expected percentage (predicted values from the model) based on the municipality’s characteristics (the six statistically significant associated variables). For reasons of standardisation, this ratio was multiplied by the national average number of euthanasia cases times 100. Finally, in order to present the remaining variation, factor scores were recalculated and compared with the unadjusted factor scores (2013–2017).
Results
Sample characteristics
Table 1 shows the sample characteristics per year as well as for the 5-year period. In total, there were 25 979 claims for euthanasia procedures between 2013 and 2017. The euthanasia ratio (by GPs) increases over these years from 2.94% to 4.33%. Slightly more men than women received euthanasia in each year. The mean age increases slightly over time, from 71.3 in 2013 to 73.2 in 2017. The second part of table 1 shows the reference data, thus providing an indication of the robustness of our data set (see the Discussion section).
Sample characteristics
Euthanasia ratio and geographical variation at three levels
Table 2 shows the euthanasia ratios and the crude factor scores (both three highest divided by three lowest, as well as the P95/P5) for PC2 regions, municipalities as well as for the districts of the three largest Dutch cities: Amsterdam, Rotterdam and The Hague. The number of municipalities and districts with a euthanasia ratio of ‘0’ is also shown. The average euthanasia ratio of the three PC2 regions with the highest ratio increases over the years, from 5.54 in 2013 to 7.63 in 2016 and 6.88 in 2017. There is a considerable variation in the incidence of euthanasia between regions, with high-incidence regions in the provinces of North Holland and Flevoland. However, since the average rate of euthanasia of the three lowest regions increases even more during this period (from 1.04 to 2.18), the variation decreases over time, from a factor score of 5.33 in 2013 to 3.15 in 2017. Looking at P95/P5, the geographical variation is smaller: the factor score of 3.41 in 2013 decreases to 2.5 in 2017.
Crude rates of euthanasia and factor scores at the level of regions (PC2), municipalities and districts (PC4)
At the level of municipalities, the average euthanasia ratios in the ‘top three municipalities’ are higher and more or less steady, at around 10%. The average percentages of the municipalities with the lowest rates of euthanasia are lower than at the PC2 level, more or less steady at around 0.5%. As a result, the factor score is much higher at the level of municipalities than at the PC2 level. The sharper rise in the incidence of euthanasia in the municipalities with low rates of euthanasia causes a decrease in variation over time, from a factor score of 27.31 to 17.03 in 2017. The P95/P5 factor scores, which leave out outliers, are lower and decrease over time, from 7.50 (2013) to 5.24 (2017). Also, there is a decrease in the number of municipalities with ≥100 deaths and ‘0’ euthanasia cases, from 13 in 2013 to 7 in 2017.
At the level of PC4 districts within the three largest cities of the Netherlands, the picture is less clear-cut. In the city of Amsterdam, the three districts with the highest rates of euthanasia had an average of 11.88% in 2013, which increased to 14.43% in 2017. In Rotterdam, the nation’s second city, this number is more or less steady at 6% during these years, whereas in The Hague the rate of euthanasia in the districts with the highest rates increased between 2013 and 2017 (from 7.38% to 11.23%). Between the high-incidence and the low-incidence districts there is a variation of factor scores of 7 and more. Whereas variation increases in Amsterdam, a rise in the rates of euthanasia in low-incidence districts in Rotterdam and The Hague yields a decreasing variation within these cities. Districts with ≥50 deaths that have ‘0’ euthanasia cases seem to become more scarce over the years. Factor scores at the district level are less influenced by outliers: the rates of euthanasia of P95 and P5 are quite similar to the top three divided by the lowest three.
Identification of factors associated with regional variation
The left part of table 3 shows the results of the negative binomial regression model (‘full model’) for the number of euthanasia cases in 2013–2017 and all possible, non-collinear explanatory variables at the municipality level.
Summary of the full negative binomial regression model for the averaged percentage of euthanasia in 2013–2017 and all correlated, non-collinear associated variables, and summary of the reduced model, with only statistically significant variables
Six variables appeared to be statistically significantly associated with geographical variation in the prevalence of euthanasia: (1) age (a higher percentage of inhabitants in the age group of 45–64 is associated with a (3.4%) higher rate of euthanasia); (2) the percentage of frequent churchgoers (a higher percentage of people attending church at least once a month is associated with a (1.9%) lower rate of euthanasia); (3) the percentage of voters for a progressive party (a higher percentage of voters for a progressive party is associated with a (0.9%) higher rate of euthanasia); (4) the percentage of available voluntary workers (a higher percentage of voluntary workers available in a municipality is associated with a (1.3%) lower rate of euthanasia); (5) income (a higher proportion of people with high income is associated with a (3.7%) higher rate of euthanasia); and (6) self-experienced health status (a higher proportion of inhabitants who experience and report (very) good health is associated with a (2.4%) higher rate of euthanasia).
Remaining variation after adjustment
Table 4 shows the 2013–2017 unadjusted and adjusted factor scores at the municipality level. The unadjusted factor score of the highest three versus the lowest three municipalities was 25.28, or 4.54 if outliers were left out, taking the 95th and the 5th percentile as cut-off points. If we adjust for the six aforementioned variables, the adjusted factor score was 10.30 or 2.84, respectively (figure 1).
Adjusted geographical variation score for the percentage of euthanasia at the municipality level in the Netherlands
Flow chart representing study aims, data sources, applied analyses, main results and corresponding tables. GP, general practitioner; RTE, Regional Euthanasia Review Committee.
Discussion
Key results
Although on average the number of euthanasia cases in the Netherlands is, as the 2017 annual RTE report states, a ‘relatively small percentage of all deaths’ (p9),6 there is considerable geographical variation throughout the country. At the PC2 level, in the regions with the highest euthanasia ratios, roughly five times more patients died via euthanasia than in the regions with the lowest euthanasia ratios. This factor score, representing the degree of variation, decreases over the years (to 3.15 in 2017), which is mainly caused by a sharper increase of the euthanasia ratio in areas with relatively low rates of euthanasia, compared with the increase of the rate of euthanasia in high-incidence regions. At the level of municipalities with at least 100 deaths and at least 1 euthanasia case per year, the differences are much greater, yielding factor scores between 27 and 17 throughout the 5-year period. If outliers are excluded (P95/P5), factor scores are still considerable: from 7.50 in 2013 to 5.24 in 2017. Between the three largest cities in the Netherlands there are also marked differences. In Amsterdam, districts with high euthanasia ratios have a considerably higher percentage of euthanasia (11.88%–14.43%) than in Rotterdam, where the trend seems to be a decrease (from 6.00% to 5.78%). The factor scores between districts within cities are also considerable. Moreover, whereas in Amsterdam the factor scores are increasing (from 7.20 to 9.62), the factor scores in the two other big cities and at the municipality level and at PC2 level diminish.
Part of the variation in the rates of euthanasia is associated with demographic (‘age’) and health-related (‘self-perceived health’) variables. It may seem counterintuitive that in municipalities with a higher experienced and reported personal health, the rate of euthanasia is higher rather than lower. The explanation may be that in such relatively healthy municipalities those who do experience suffering may be more inclined to ask for assistance in dying. Other associated factors seem to indicate, or are related to, inhabitants’ attitudes, preferences and choice patterns regarding end of life issues (‘percentage of votes for a liberal political party’ and ‘percentage of inhabitants who attend church at least once per month’). Finally, socioeconomic factors were also associated with the variance (‘income’, but also ‘the availability of voluntary workers in a municipality’). Adjusting for these variables yields lower factor scores, thus lower variation: 10.30 instead of 25.28, still leaving a considerable part of the variation unexplained.
Limitations and generalisability
Our data contain euthanasia procedures claimed by GPs. No claims data are available on euthanasia procedures performed by medical specialists in hospitals. This causes a slight underestimation of the total number of euthanasia procedures that were performed in each year. Since 85% of euthanasia cases are performed by GPs (see reference data in table 1), and there are no indications that in certain regions a larger proportion of euthanasia procedures are performed by medical specialists than in other regions, we believe that our focus on GP data adequately represents the average Dutch euthanasia practice and causes no bias in geographical variation in euthanasia practice. Moreover, the total amount of claimed procedures approximates the figures found in the RTE annual reports (see table 1). The fact that the ‘covering percentage’ of our claims data with those of the RTEs lies above 100% for most years (ranging from 96% in 2013 to 106% in 2017) has in all likelihood to do with the fact that since 2012 physicians from the ‘Expertisecentrum Euthanasie’ (known originally as ‘End of Life Clinic’) have been providing euthanasia outside regular doctor–patient relationships, but sometimes claim their activities as a GP. Whereas the RTE reports distinguish cases of euthanasia performed by GPs from those performed by the Expertisecentrum, we were not able to make such distinctions in our claims data due to privacy prerequisites. As a result, a small but increasing proportion of euthanasia cases claimed by GPs may have been reported by RTEs as euthanasia performed by Expertisecentrum physicians. This is also underpinned by data from the centre itself, which reported a rapidly growing number of euthanasia cases over the last few years: from 134 in 201343 to 898 in 2019.44
Another characteristic of our study that might be seen as a limitation is that our main data source is billing data, which are originally not meant for epidemiological or quality-of-care analyses. As a result we had no data about the underlying diagnoses or pathologies of our sample. Also, our data contain only euthanasia procedures by GPs and lack information on such procedures by other medical specialties. Furthermore, data on possible explanatory variables were only available at the municipality level and not at the level of individual patients (except for age and gender). If results are not carefully interpreted, this may lead to an ‘ecological fallacy’, that is, that conclusions are drawn at the level of individuals who received euthanasia, while explanatory data were measured at the level of the community.45 However, we think we treat our findings with required caution, for example by showing ‘associations’ between cluster characteristics instead of causal explanations at the individual level.
All in all, we think that our data ‘fit the job’, given the fact that the number of euthanasia cases we found in the claims data matched quite well with the national data of the RTEs (see reference data in table 1); most euthanasia procedures are actually performed by GPs (85%), and the number of euthanasia procedures as well as the number of total deaths at the municipality level gave us enough power for our (negative binomial regression) modelling.
A final point of discussion is that we also adjusted for the variable ‘the percentage of volunteer workers available in a municipality’. One could argue that in adjusting for this variable we unjustifiably accept as a fait accompli that the lack of voluntary workers (indicating a lack of social cohesion and informal care in a local context) leads to more euthanasia. Does the percentage of volunteer workers really reflect an autonomous wish of the members of a community? Should we not rather argue that it is a municipality’s task to stimulate and facilitate the number of available voluntary workers?
All in all, we think our results are highly generalisable because of the quality of both the data and the analyses performed on them.
Interpretation
In their earlier study Koopman and Putter17 found euthanasia ratios between the five regions varying from 1.7% to 5.6% of the overall mortality. These differences are replicated in the present study. The authors also concluded that research is necessary to explore geographical variation in greater detail. In our study, based on detailed data about the use of medical care by patients in the last year of their lives, we are able to fill part of this void. As expected, our more detailed data unveiled an extensive geographical variation between and within municipalities. Historically, geographical variation in healthcare utilisation is explained by behavioural and distributional differences,18 or put differently: by patients’ preferences and providers’ supply. With the help of data from a range of sources we have explored this variation in terms of demographic, socioeconomic, preferential and health-related factors. We found that factors that directly or indirectly reflect patients’ personal preferences and needs (such as religion, political views and income) are associated with geographical variation. Still, even when adjusted in terms of these characteristics, the considerable remainder of geographical variation calls for further exploration. The odds that a deceased person received assistance in dying were seven times higher in the three municipalities with the highest euthanasia ratio, compared with the three municipalities with at least 100 deaths and at least 1 euthanasia case. As in other instances of geographical variation, such as in orthopaedics, ophthalmology and general surgery, the most important remaining explanatory factor (after adjustment for differences in patients’ health, demographics and preferences) may be described in terms of supply.46–48 In the case of euthanasia, this may encompass two things: first, the incidence of euthanasia may be influenced by the GP’s preparedness and inclination to supply euthanasia. This conclusion is underpinned by a recent qualitative study among GPs that found that healthcare choices at the end of life of patients are considerably influenced by medical opinions of GPs of what a good death looks like.49 Second, the incidence of euthanasia may also be influenced by the availability of and access to (good) palliative care. In the Netherlands, considerable geographical variation in the availability and quality of palliative care has been reported.50 Unfortunately, although there is an atlas of (availability of) palliative care in Europe,51 no such data are available in the Netherlands at the level of municipalities or districts. Regarding the quality of palliative care, we know from a survey held among a network of consulting doctors that suboptimal palliative care was at stake in 10% of euthanasia requests.52 53 Although there is a national quality framework for palliative care in the Netherlands,54 these data are not (yet) available at the level of municipalities or districts. We strongly recommend that efforts be made in the near future to collect such data (and data on the other factors we identified) at the level of individual euthanasia cases, and distribute them for purposes of (research that contributes to) quality improvement in end of life care.
The question is whether supplier-induced demand for euthanasia is problematic, similar to how it is in other fields of medicine. Variation in healthcare utilisation, caused by other factors than (1) local differences in health status, (2) medical evidence or (3) patients’ preferences, is generally seen as problematic, or even as unwarranted, either in terms of underuse, overuse or misuse.48 55 If this is true when factor scores between 2 or 3 are found,41 this may all the more apply in the case of euthanasia with factor scores of about 7 and higher.
We think our findings have potential relevance for countries that already have a legal practice of assisted dying—Belgium, Luxembourg, Columbia, Canada, Western Australia and 10 US states—and for countries currently considering to legalise such a practice, such as Spain, New Zealand, Germany and Portugal.
Recommendations
What should be done next now that we have shown considerable geographical variation in the prevalence of euthanasia and its association with several demographic, socioeconomic, preferential and health-related factors? Our agenda encompasses four additional research topics, flanked by some necessary quality improvement steps.
First, we suggest that also in other countries with a legal assisted dying practice small area variation research be initiated. Second, we need a more detailed study of patients’ preferences and professionals’ opinions, visions and preparedness to offer assisted dying. In the Netherlands such studies have been performed recently,56 but the data are not available at a level which is detailed enough to be statistically useful. Third, we may need an exploration of geographical variation in euthanasia other than in terms of the associated factors that we included in this study. This may include the association between geographical variation in rates of euthanasia and geographical differences in access to and quality of palliative care as well as its organisation. Finally, more attention should be given to the ethical aspects of geographical variation in healthcare utilisation at the end of life, since they have been given only sparse attention until now.57
Practice variation literature teaches us that mapping the existing variation and its disclosure to the public may spark quality improvement. However, real change in persistent patterns of practice variation requires the next steps on the so-called ‘value improvement cycle’.58 First, data should be fed back to those who produce them: that is, physicians who are involved in the practice of euthanasia. Second, together with representatives of the Royal College of General Practitioners and other involved physicians, all possible explanations for geographical variation in euthanasia should be discussed, including results such as in the present study. Third, other stakeholders should be involved in the discussion: referring physicians, payers (eg, insurers) and patients with their families. Finally, interventions could be developed and implemented when agreed on, such as clearer guidelines for euthanasia, ‘better-not-do-lists’ or ‘wise choices’, which have proven to be effective in other parts of end of life care.59 60
Data availability statement
Data are available upon reasonable request with the first author of the article. The results will be disseminated to both patient organisations (NVVE, NPV, Dutch Patient Federation), and physicians organisations (NHG, LHV, KNMG).
Ethics statements
Patient consent for publication
Acknowledgments
We thank Mark Noordenbos for creating the maps in table 2 and Yvonne de Man for preparing the Vektis data set.
References
Supplementary materials
Footnotes
Twitter @stefgroenewoud
Correction notice This article has been corrected since it first published. The provenance and peer review statement has been included. Also, author reported a regional variation in euthanasia with a factor of 7 difference after adjusting for various health-related and preference factors, however, the most recent analyses revealed that this is an underestimate: this factor should be 10.30.
Contributors All authors meet the requirements for authorship, have seen and approved the final version of this manuscript, and are aware of and agree to this submission.
Funding The authors have not declared a specific grant for this research from any funding agency in the public, commercial or not-for-profit sectors.
Competing interests None declared.
Provenance and peer review Not commissioned; externally peer reviewed.