Article Text

Abstract
Objective Unplanned hospitalisations can be burdensome for older people who approach the end of life. Hospitalisations disrupt the continuity of care and often run against patients’ preference for comfort and palliative goals of care. This study aimed to describe the patterns of unplanned hospitalisations across illness trajectories in the last year of life.
Methods Longitudinal, retrospective cohort study of decedents, including all older adults (≥65 years) who died in Sweden in 2015. We used nationwide data from the National Cause of Death Register linked at the individual level with several other administrative and healthcare registers. Illness trajectories were defined based on multiple-cause-of-death data to approximate functional decline near the end of life. Incidence rate ratios (IRR) for unplanned hospitalisations were modelled with zero-inflated Poisson regressions.
Results In a total of 77 315 older decedents (53% women, median age 85.2 years), the overall incidence rate of unplanned hospitalisations during the last year of life was 175 per 100 patient-years. The adjusted IRR for unplanned hospitalisation was 1.20 (95%CI 1.18 to 1.21) times higher than average among decedents who followed a trajectory of cancer. Conversely, decedents who followed the trajectory of prolonged dwindling had a lower-than-average risk of unplanned hospitalisation (IRR 0.66, 95% CI 0.65 to 0.68). However, these differences between illness trajectories only became evident during the last 3 months of life.
Conclusion Our study highlights that, during the last 3 months of life, unplanned hospitalisations are increasingly frequent. Policies aiming to reduce burdensome care transitions should consider the underlying illness trajectories.
- hospital care
- end of life care
- terminal care
Data availability statement
Data may be obtained from a third party and are not publicly available. Clinical data cannot be made publicly available because of privacy issues. However, additional results and aggregated findings are available in the supplementary files or on reasonable request.
This is an open access article distributed in accordance with the Creative Commons Attribution Non Commercial (CC BY-NC 4.0) license, which permits others to distribute, remix, adapt, build upon this work non-commercially, and license their derivative works on different terms, provided the original work is properly cited, appropriate credit is given, any changes made indicated, and the use is non-commercial. See: http://creativecommons.org/licenses/by-nc/4.0/.
Statistics from Altmetric.com
Key messages
What was already known?
Most older adults prefer avoiding care transitions near the end of life, yet prior studies have found an acceleration of hospital admissions close to death.
Although hospital admissions are not necessarily unwarranted, avoiding burdensome emergency room visits and unplanned hospitalisations is often an important goal for patients with severe illness.
What are the new findings?
Differences in unplanned hospitalisation across illness trajectories become evident during the last 3 months of life.
Older people who died with cancer bear the highest burden of unplanned hospitalisations at the end of life.
What is their significance?
Illness trajectories defined based on causes of death have obvious limitations but are nonetheless useful to differentiate end-of-life care patterns.
Policies aiming at avoiding unwarranted care transitions near the end of life should tailor interventions to specific illness trajectories.
Introduction
Most older adults prefer to avoid care transitions at the end of life.1 2 Yet, such transitions—including hospital admissions and emergency department visits—are common and increasingly frequent as death approaches.3–8 Hospitalisation close to death can fragment the care continuity and planning, and have negative functional and psychological consequences.4 It can also lead to suboptimal quality of care,9 overdiagnosis and overtreatment.10 Hospitalisations are often stressful for patients and caregivers; disproportionately so for individuals with advanced age and/or physical and cognitive impairments.11
A substantial body of research has documented the accelerating pattern of hospital admissions at the end of life. However, most studies have not been able to distinguish between planned and unplanned hospitalisations.3 5–8 Yet, this distinction is essential since unplanned admissions have the potential to disorganise patient care.4 Although it should be noted that unplanned hospitalisations are not necessarily unwarranted or avoidable (and may even sometimes be in line with the patients’ preferences), avoiding burdensome admissions becomes an important goal when the main priority of care is to maximise comfort and quality of life as death approaches.5 12–14
There is a lack of knowledge about which groups of individuals are at the highest risk of unplanned hospitalisations and at which point these are likely to occur throughout the end of life. Seriously ill individuals are expected to follow different trajectories of functional decline at the end of life, depending on their underlying illness.15 16 Hence, their use of hospital care at the end of life might also differ substantially. To verify this hypothesis, the present study aimed to describe the patterns of unplanned hospitalisations across illness trajectories in the last year of life. We used longitudinal administrative and healthcare data and assembled a mortality follow-back cohort including all older people who died in 2015 in Sweden.
Methods
Study design and population
This was a retrospective cohort study of decedents including all older adults (age ≥65 years) who died between 1 January and 31 December 2015 in Sweden. Decedents were excluded if their exact date of death was unknown, if their unique personal identifier had been reallocated to another person, or if their cause of death was either unknown, not reported or unspecific (online supplemental eFigure 1).
Supplemental material
Data sources
We used routinely collected administrative data with national coverage in Sweden. Data from the National Cause of Death Register were linked to the National Patient Register, the Swedish Prescribed Drug Register, the Total Population Register and the Swedish Register of Education with a pseudonymised identifier (online supplemental eTable 1).17
Illness trajectories
Causes of death recorded on the death certificates were categorised into four distinct illness trajectories at the end of life, as proposed by Lunney et al18 : (1) cancer, characterised by a short period of functional decline; (2) organ failure, marked by a longer period of functional limitations with intermittent acute decompensations; (3) prolonged dwindling, typical of older persons with neurodegenerative conditions and/or frailty; (4) sudden death, namely none of the three abovementioned trajectories.19 International Classification of Disease-10th revision codes used to operationalise each illness trajectory are available in online supplemental eTable 2. In keeping with previous studies, we used a rule-based algorithm to allocate decedents to a single illness trajectory if the underlying and contributing causes of death were compatible with two or more trajectories.18 20 The following hierarchy was applied: cancer>prolonged dwindling>organ failure>sudden death. This hierarchy is based on the assumption that, when multiple trajectories are present, the faster progressing trajectory will determine most of the burden of functional decline over time. For instance, cancer is at the top of the hierarchy because a diagnosis of cancer have been shown to dominate other co-occurring diseases when included in the list of multiple causes of death.19 21 The conceptual and operational difficulties of creating definite, clear-cut categories from complex events leading to death have been pointed out by others.15 18 22 A particular challenge of delineating illness trajectories is that some decedents might follow none, some or all of these trajectories at the same time. However, in the absence of fine-grain data about actual longitudinal changes in physical and cognitive functions experienced near the end of life—which require extensive clinical information typically not available in routinely collected data—these four groups of illnesses have been found to be a good proxy for the pattern of late-life functional decline and care needs at the end of life.23
Outcome
Unplanned hospital admissions throughout the last year of life were captured in the National Patient Register, which covers >99.9% of all inpatient care admissions and >85% of specialised outpatient care visits.24 Unplanned hospitalisations were defined as admissions recorded as being non-elective in the National Patient Register. We calculated the incidence rate of unplanned hospitalisations during the entire last year of life and during each of the 52 weeks (7-day hazard periods) before death. To prevent immortal-time bias—namely, considering hazard periods during which the study outcome cannot occur, time at risk was defined as the number of days when the persons were not hospitalised.25 Hospitalisations separated by 1 day or less were concatenated into a single episode in order to avoid counting transfers from one hospital unit to another as separate admissions. Incidence rates and their 95% CIs were calculated per 100 person-years or per 100 person-weeks, as appropriate.
Patient-level characteristics
We extracted the main sociodemographic characteristics of decedents (eg, sex, age at death, marital status) from national registries. Chronic multimorbidity was operationalised as the number of chronic diseases out of a list of 60 pre-defined conditions,26 which were captured in the National Patient Register during the period ranging from 5 to 1 year before death (online supplemental eTable 3). We estimated the Hospital Frailty Risk Score27 based on the same data (online supplemental eTable 4). Education was defined as the lifetime highest attained educational level, and was categorised into primary, secondary and tertiary education based on the International Standard Classification of Education 1997 system28 (online supplemental eTable 5). Polypharmacy was assessed during week 56–53 before death. It was calculated as the average number of prescription drugs (at the therapeutic/pharmacological subgroup level of the Anatomical Therapeutic Chemical classification system) that the decedents were exposed to across each of the 4 weeks preceding the last year of life.29
Statistical analysis
In the main analysis, we calculated the incidence rate of unplanned hospitalisations during the last year of life. Zero-inflated Poisson regression models were used to compute incidence rate ratios (IRRs) to compare the risk of unplanned hospitalisation across illness trajectories with regard to the average risk in the cohort. Zero-inflated Poisson models were warranted because of the substantial number of individuals with no unplanned admission (‘excess zeros’). To confirm the appropriateness of the zero-inflated model, we first plotted the quantiles of the observed values of unplanned hospitalisations against the quantiles of their normal distribution (online supplemental eFigure 2). Second, we plotted the individual predicted probabilities under the zero-inflated model against that of the Poisson model30 (online supplemental eFigure 3). In both instances, deviations from the reference line indicated overdispersion with excess zeros. Finally, we compared the Akaike Information Criterion of the Poisson and zero-inflated models to see whether the latter obtained a better fit. Potential confounders were identified in the published literature and selected based on subject-matter knowledge. Analyses were thereafter adjusted for age at time of death, sex, marital status (married, single/divorced and widowed), chronic multimorbidity,26 Hospital Frailty Risk Score,27 polypharmacy29 and level of education (primary, secondary and tertiary). The logit function used to model the excess zeros was adjusted on the Hospital Frailty Risk Score and the cumulated length of hospital stays between 731 and 366 days before death. We also investigated the average weekly change in the rate of unplanned hospitalisations throughout the last year of life according to the decedents’ illness trajectory. We calculated the relative IRRs as the effect estimate for the interaction between illness trajectory and time. For this, a generalised estimating equations model with Poisson family and log link function was fitted by using restricted cubic spline with knots at 9, 6 and 3 weeks before death, with double-robust SEs to estimate unbiased 95% CIs. This analysis was adjusted for the same confounders as the primary analysis.
In prespecified sensitivity analysis, decedents with acute and potentially unexpected cause of death were identified by using a previously published algorithm31 (online supplemental eTable 6) and thereafter excluded. The rational for this analysis was that death can still be largely unexpected regardless of the underlying illness trajectory: it is likely that these patients experienced unplanned hospitalisations that were clinically justified by an acute and life-threatening event, in a context where the goals of care were essentially curative. In post-hoc analysis, we repeated the IRR calculation of unplanned hospitalisation across illness trajectories during the last year of life using regular Poisson models, instead of the zero-inflated model. All analyses were performed with SAS software V.9.432 and R statistical software V.3.6.1,33 The present study was reported in keeping with the Reporting of studies Conducted using Observational Routinely-collected Data guidelines34 (online supplemental eTable 7).
Results
Characteristics of the study population
Out of 79 473 individuals who died in 2015, 77 315 (97.3%) met our eligibility criteria (online supplemental eFigure 4). Their characteristics are shown in table 1. Overall, 30% of decedents followed a trajectory typical of cancer, 37% organ failure and 26% prolonged dwindling. Over 60% of those who followed a trajectory of prolonged dwindling were women, and only the cancer trajectory included more men than women. Median age at death was 85.2 years (IQR 77.7–90.7) with the decedents of the prolonged dwindling trajectory being the oldest while cancer decedents the youngest. One year before death, older people had a median of 4 (IQR 2–7) chronic diseases and were prescribed 5 (IQR 3–8) medications. Among the 5700 (7%) older people who followed a trajectory of ‘sudden death’, the most common causes of death included acute myocardial infarction, pneumonia, sepsis, aortic aneurysm and dissection and fall-related injuries (online supplemental eTable 8).
Characteristics of the study population
Incidence rate of unplanned hospitalisations
Overall, decedents had on average 1.66 unplanned hospitalisations during their last year of life, with an incidence rate of 175 per 100 patient-years (table 2). Decedents who followed a trajectory of cancer had the highest incidence rate (231 per 100 patient-years), while individuals following a trajectory of prolonged dwindling had the lowest (99 per 100 patient-years). After adjusting on available confounders, decedents with cancer had 1.20 (95% CI 1.18 to 1.21) times higher risk of unplanned hospitalisation than average. Conversely, decedents who followed a trajectory of prolonged dwindling and those who died in the sudden death trajectory had lower-than-average risks of unplanned hospitalisation (IRRs: 0.66 (0.65–0.68) and 0.79 (0.77–0.82), respectively).
Incidence of unplanned hospitalisation during the last year of life, by illness trajectory
Longitudinal changes in the incidence of unplanned hospitalisation
Throughout the last year of life, the incidence rate of unplanned hospitalisation increased from 1.5 to 26.2 per 100 patient-weeks, regardless of illness trajectory or age (figure 1). There was a particularly steep increase among decedents who died suddenly (from 1.0 to 43.9 per 100 patient-weeks) and those with organ failure (from 1.8 to 38.0 per 100 patient-weeks). Detailed data are provided in online supplemental eTables 9 and 10, eFigure 5. We found that these incidence rates did not increase in a linear fashion and that differences between illness trajectories were marginal until the third month before death. Among decedents who followed a cancer trajectory, the rate of unplanned hospitalisations started increasing ~16 weeks before death, compared with ~8 weeks before death among older adults who died from organ failure and ~4 weeks among those who followed a trajectory of prolonged dwindling or sudden death.
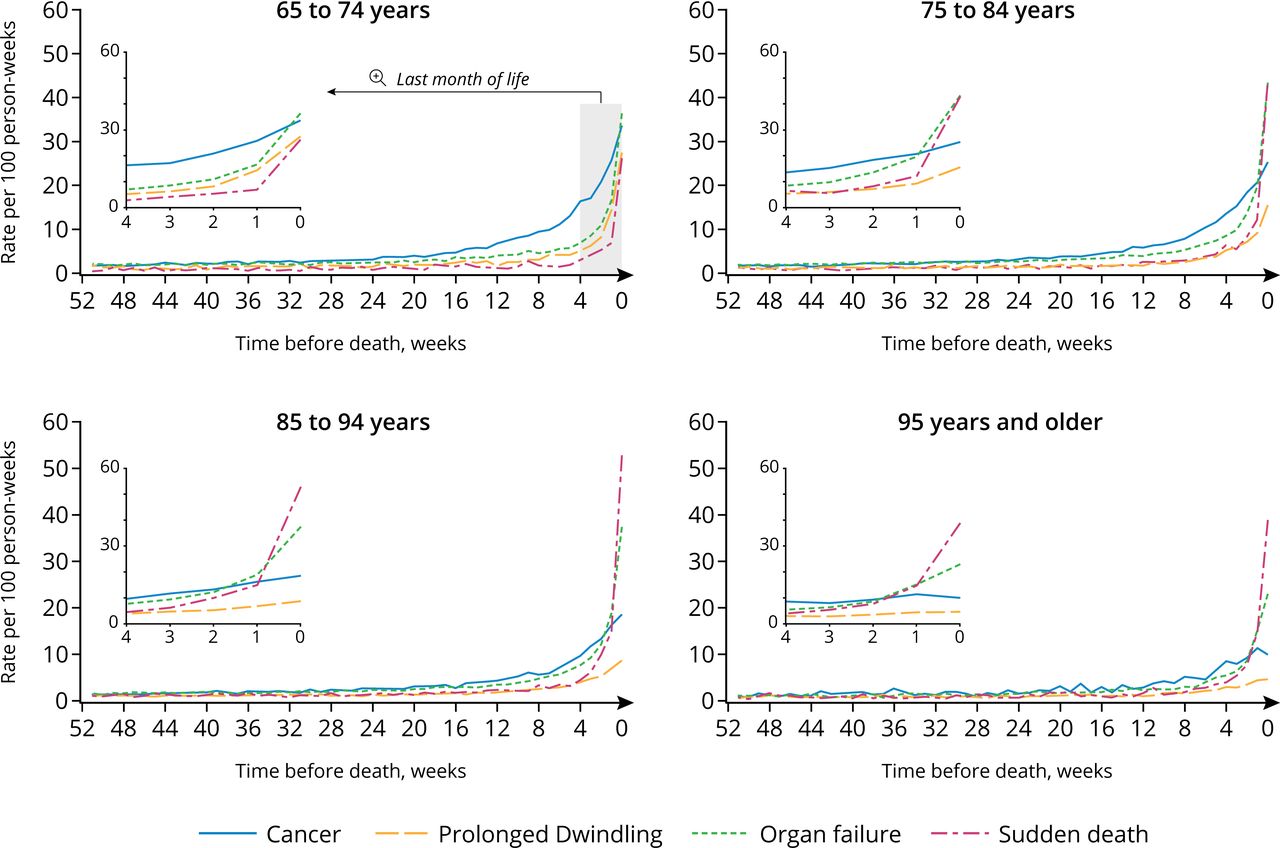
Incidence rate of unplanned hospitalisations throughout the last year of life, by age group and illness trajectory.
During the last 3 months of life, we found substantial variations in the speed at which the rate of unplanned hospitalisations increased across the different illness trajectories. Older people who died from sudden causes had the fastest increase in the risks of unplanned hospitalisation (relative IRR: 1.12, 95% CI 1.11 to 1.13), while decedents who followed a trajectory of cancer or prolonged dwindling trajectories had slower-than-average increases (table 3).
Average weekly change in the rate of unplanned hospitalisations throughout the last year of life, by illness trajectory
A more nuanced pattern emerged after we used restricted cubic splines to relax the assumption that the change in the risk of unplanned hospitalisation was linear over time. Figure 2 shows the relative IRRs of unplanned hospitalisations during the last 12 weeks of life for each illness trajectory compared with the overall study population. Relative IRRs correspond to the speed at which the incidence of unplanned hospitalisation increased over time, week12 being the reference period. Hence, the rate of unplanned hospitalisations among older people who followed a trajectory of cancer increased at a faster-than-average speed between the 12th and the 3rd week before death, after which we observed an acceleration among individuals who died from organ failure or sudden death while older people who followed a trajectory of prolonged dwindling experienced a substantially slower-than-average increase.

Change in the incidence rate of unplanned hospitalisations throughout the last 12 weeks of life, by illness trajectory.
Sensitivity analyses
The prespecified sensitivity analysis showed that about 45% of the study population had a potentially unexpected cause of death, regardless of their illness trajectory (online supplemental eTable 11). Repeating the main analysis after excluding decedents with potentially unexpected cause of death did not change the direction or magnitude of our results (online supplemental eTables 12 and 13, eFigure 6). In non-prespecified post-hoc analyses, the IRRs for unplanned hospitalisations throughout the entire last year of life did not change in a scientifically important or clinically relevant manner when fitting a regular Poisson model instead of the zero-inflated variant used in primary analysis (online supplemental eTable 14).
Discussion
In this large, register-based cohort study, we found that the incidence of unplanned hospitalisations during the last year of life was comparable across illness trajectories until the third month before death. After this time point, unplanned hospitalisations became increasingly frequent and differences between illness trajectories became evident. The incidence of unplanned hospitalisations started increasing among decedents with cancer trajectory, followed by those with organ failure. Older people with a trajectory of prolonged dwindling (often characterised by dementia) experienced a more modest increase in the risk of unplanned hospitalisation, mostly during the final month of life.
Unplanned hospitalisations are frequent at the end of life. We found that 18% of older adults in Sweden have at least one unplanned hospitalisation during their last week of life. In comparison, 11% of US Medicare beneficiaries in 2015 had at least one healthcare transition in their last 3 days of life. Overall, the incidence rate of unplanned hospitalisation in our cohort was low between 12 and 3 months before death and illness trajectories seem to offer little discriminative ability to differentiate unplanned hospitalisation during this period. However, the patterns of unplanned hospitalisations started to diverge across illness trajectories during the last 3 months before death. Our finding that the incidence rate of unplanned hospitalisations increases close to death is consistent with previous studies, although with somewhat different timings.3–8
Overall, cancer decedents bear the highest burden of unplanned admissions during the last year of life, a finding well in line with a recent report from Public Health England.35 This may be partly attributable to the worsening of pain and other distressing symptoms as death approaches. Older people who died from organ failure had the second highest incidence of unplanned hospitalisation, with a steep acceleration near the end of life. This pattern may be connected with the increasingly frequent exacerbation of symptoms and acute deterioration of disease close to death, which sometimes warrant immediate inpatient care. Finally, individuals who followed a trajectory of ‘prolonged dwindling’ (most often characterised by dementia) had the lowest and slowest increase in incidence of unplanned admission during the last year of life. Their significant symptom burden, poorer-than-average access to symptom relief36 37 and high levels of physical frailty at the end of life would suggest greater utilisation of emergency hospitalisation. However, their observed lower propensity of unplanned hospitalisation may be explained by difficulties in communicating and relatives acting as gatekeepers, and by the fact that they are more likely to live in nursing homes38 that provide more medical care than home-based care.39 Older adults with sudden death had the highest incidence rate of unplanned hospitalisation during the last weeks of life. Their most common causes of death included events that are likely to result in necessary unplanned hospitalisation followed by imminent death, for example, acute myocardial infarction.
Unplanned hospitalisations close to death are not always avoidable and are sometimes in line with patients’ preferences, but they can nonetheless have adverse outcomes.4 9–11 40 41 Studies suggest that a substantial fraction of unplanned hospitalisations can be reduced by integrative anticipatory palliative care and advanced care planning.42–45 It has been also reported that routinely collected administrative data can be used to identify persons with potential palliative care needs.46 Our results indicate that the patterns of different illness trajectories should be considered when planning policies aiming to reduce unplanned hospitalisations, especially in the very last months before death. The unique hospitalisation pattern of decedents in the sudden death trajectory suggests that it is relevant to differentiate them from older people who could potentially benefit from integrated palliative care. However, basing decisions on the illness trajectories requires that the trajectories are identified prospectively and not based on causes of death. Future studies should investigate how well register data can be used to identify illness trajectories as older people near death.
Strengths of the study include routinely collected data with nearly 100% nationwide coverage which eliminates non-participation bias and reduces the risk of outcome misclassification as there is no recall or information bias. However, our findings should be interpreted with the following limitations in mind. First, retrospective cohorts of decedents have the potential to introduce selection effects and immortal-time bias,47 which we addressed by conducting thorough sensitivity analyses. Second, illness trajectories were identified at the time of death and not at the outset of the underlying condition, which may have led to some degree of exposure misclassification (ie, the applied illness trajectory hierarchy might have caused overestimation of the cancer trajectory) and immortal-time bias (exposure time might have been misclassified for those who did not have any condition in a portion of the last year of life that could explain unplanned hospitalisations). Second, defining illness trajectories into four broad categories is an oversimplification of the clinical processes that lead to death in old age. Yet, despite their obvious limitations, these illness trajectories remain a useful tool to approximate the late-life functional decline patterns that warrant different health services needs at the end of life.23 Third, the data used in the present study do not allow for forming a judgement about whether or not each individual unplanned hospitalisation was clinically and ethically appropriate, or whether it resulted in health gains or losses for the patients. Our population-level findings can thus be used to inform public health strategies and care commissioning choices, but not to evaluate individual decisions in clinical practice, which are made case-by-case with more detailed information about the healthcare needs of patients and about their preferences and priorities. Finally, our findings stem from the context of the Swedish universal healthcare system and may thus not be entirely transportable to other countries with different healthcare systems.
Conclusion
Unplanned hospitalisations are common at the end of life, especially during the last 3 months. Decedents belonging to different underlying illness trajectories had divergent patterns of unplanned hospitalisations during their last 3 months of life. This should be considered in healthcare policies aiming to reduce burdensome care transitions and improve comfort at the end of life. Future studies are warranted to investigate how illness trajectories can inform advance care planning and whether the observed trends in late-life unplanned hospitalisations are in keeping with patients’ preferences and goals of care.
Data availability statement
Data may be obtained from a third party and are not publicly available. Clinical data cannot be made publicly available because of privacy issues. However, additional results and aggregated findings are available in the supplementary files or on reasonable request.
Ethics statements
Ethics approval
The study was approved by the Regional Ethical Review Board of Stockholm (dnr: 2016/1001-31/4).
Acknowledgments
The authors wish to thank Michael Sachs for his helpful comments and suggestions regarding the statistical analysis.
References
Supplementary materials
Supplementary Data
This web only file has been produced by the BMJ Publishing Group from an electronic file supplied by the author(s) and has not been edited for content.
Footnotes
Contributors LM and MS conceived and designed the study. MS performed the statistical analysis, interpreted the data, drafted and critically revised the manuscript. LM, JWW and KJ interpreted the data and critically revised the manuscript. KJ obtained funding, provided supervision, interpreted the data and critically revised the manuscript. LM is the guarantor of the study and data integrity. All authors gave approval for the final version of the manuscript and agree to be accountable for all aspects of the work.
Funding This work was supported by funding from the Swedish Research Council for Health, Working Life and Welfare (FORTE) and KID-funding. The sponsor had no role in study design, data collection and analysis, decision to publish or preparation of the manuscript.
Competing interests None declared.
Provenance and peer review Not commissioned; externally peer reviewed.