Article Text

Abstract
Objectives To analyse healthcare utilisation and costs in the last year of life in England, and to study variation by cause of death, region of patient residence and socioeconomic status.
Methods This is a retrospective cohort study. Individuals aged 60 years and over (N=108 510) who died in England between 2010 and 2017 were included in the study.
Results Healthcare utilisation and costs in the last year of life increased with proximity to death, particularly in the last month of life. The mean total costs were higher among males (£8089) compared with females (£6898) and declined with age at death (£9164 at age 60–69 to £5228 at age 90+) with inpatient care accounting for over 60% of total costs. Costs decline with age at death (0.92, 95% CI 0.88 to 0.95, p<0.0001 for age group 90+ compared with to the reference category age group 60–69) and were lower among females (0.91, 95% CI 0.90 to 0.92, p<0.0001 compared with males). Costs were higher (1.09, 95% CI 1.01 to 1.14, p<0.0001) in London compared with other regions.
Conclusions Healthcare utilisation and costs in the last year of life increase with proximity to death, particularly in the last month of life. Finer geographical data and information on healthcare supply would allow further investigating whether people receiving more planned care by primary care and or specialist palliative care towards the end of life require less acute care.
- end of life care
This is an open access article distributed in accordance with the Creative Commons Attribution Non Commercial (CC BY-NC 4.0) license, which permits others to distribute, remix, adapt, build upon this work non-commercially, and license their derivative works on different terms, provided the original work is properly cited, appropriate credit is given, any changes made indicated, and the use is non-commercial. See: http://creativecommons.org/licenses/by-nc/4.0/.
Statistics from Altmetric.com
Background
Around half a million people die each year in the England, with more than a fifth older than 90 years.1 While 70%–80% of those who die would benefit from palliative care2 over 90 000 decedents per year have unmet palliative care needs3 that can differ widely by disease and are influenced by the availability of appropriate care and patient preferences.4 5 Previous research has shown that many dying patients receive high-intensity care without clear evidence of benefits, often at odds with their known preferences.6 7 While many people at the end of life would prefer to be cared for at home, around 90%8 spend time in hospitals in their final year of life and over 50% of people die there.9
We define healthcare use trajectories as the sequence of interactions with the primary and secondary care, including general practitioner (GP), outpatient and inpatient visits. This enables patterns of healthcare use to be described for patient groups with certain characteristics. A more normative approach consists in describing the intensity of healthcare use, which enables the value of specific service use to be questioned. This is particularly important for palliative and end-of-life care where the balance between benefit and harm of intensive treatments can be questionable.
Evidence suggests that excessive inpatient care could be avoided if patients were offered high-quality alternatives10 11 that provide care in line with their preferences while also reducing cost of care that is, on average, five times higher in the last year of life than in previous years.12 England has been at the forefront of palliative and other high quality care at the end of life.13 However, the increasing complexity and heterogeneity of patient needs and pressures on healthcare budgets pose considerable challenges to the provision of high quality, equitable end-of-life care aligned with patient preferences.
Over the past decade, large patient-level datasets have become increasingly available and now allow investigators to follow patients along their entire care pathways, as they interact with primary and secondary care.14 15 These resources make it possible to study the heterogeneity of decedent trajectories in a range of care settings. To date, few studies have analysed utilisation of a breadth of healthcare services and associated costs in the last months of life in the UK.14 15 These studies suggest that higher healthcare use is associated with a range of patient characteristics (including age, gender and cause of death) and that hospital costs account for most end-of-life care costs all of which increase significantly with proximity to death and decline with age.
With two notable exceptions,9 16 these studies focused on cost trends and how they are affected by age and proximity to death. They examined neither variation in cost trajectories nor the intensity of care provided. In contrast, this study aims to analyse a patient-level linked dataset covering primary care, hospital outpatient and inpatient care and assess the intensity of services of people 60 years and over, received in the last year and last month of life and how these differ by cause of death, region of residence and socioeconomic status.
Methods
Study design
We conducted a retrospective cohort study of people aged 60 years and over, who died between 2010 and 2017. We relied on routinely collected linked data from a nationally representative sample of the English population.
Data sources
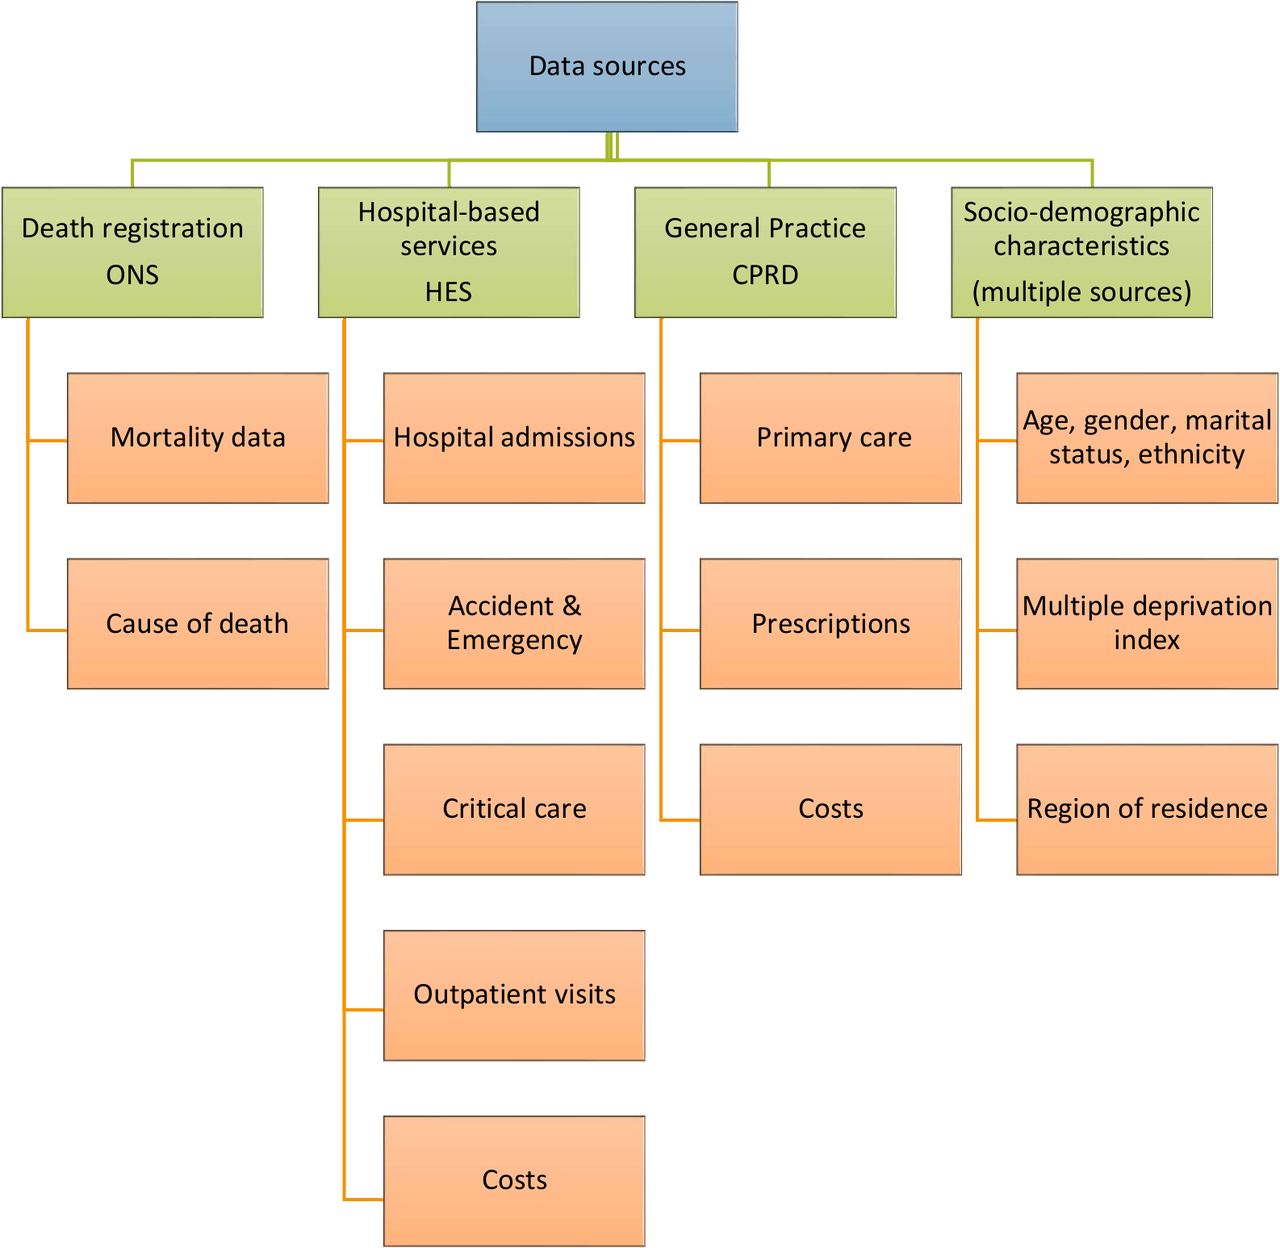
We used individual-level data linked from three sources: Clinical Practice Research Datalink (CPRD), Hospital Episode Statistics (HES) and death registrations provided by the Office for National Statitics. CPRD is an ongoing research service providing electronic medical record data across GP practices in the UK, covering approximately 7% of the population.17–19 HES provides data on secondary care use in England, including hospitalisations, Accident & Emergency (A&E) contacts, intensive care unit (ICU) use and outpatient care. This was supplemented with data from the English Index of Multiple Deprivation (IMD) at the level of the lower super output area of the patient’s residence.20 A detailed description of available data sources is provided in figure 1. These data were linked using unique patient identifiers.

Description of data sources. CPRD, Clinical Practice Research Datalink; HES, Hospital Episode Statistics; ONS, Office for National Statitics.
Inclusion and exclusion criteria
The original sample size included 510 307 individuals. Of these, 289 688 met the initial inclusion criteria and 178 176 of those who did not die during study period were excluded from the analysis. We therefore included 108 510 patients aged 60 years and over at study inception (1 January 2010), who died during the study period, were registered continuously with CPRD for at least 12 months and met data quality requirements. We estimate that during the same period 2010–2017 around 3 million deaths have occurred in England in the age group 60 and older, our final sample therefore represents 3.5% of this population of decedents. A detailed description of inclusion and exclusion criteria is provided in online supplemental file 1.
Supplemental material
Patient characteristics
Patient characteristics included age at death (60–69, 7079, 80–89, 90+), gender and primary cause of death based on International Classification of Diseases (ICD-10) codes (cancer, diseases of the nervous system, dementia and Alzheimer’s disease, chronic obstructive pulmonary disease (COPD), other respiratory diseases, heart failure, ischeamic heart diseases, cereberovascular disease, other circulatory diseases, external causes, infectious diseases and ‘other’). We calculated the comorbidity burden over the last 5 years of life, categorised into four groups (0, 1–3, 4–6, 7+) using the Charlson Comorbidity Index.21 In addition, we included the patient’s government office region and IMD information about the patient’s usual small area of residence.
Outcome measures
Inpatient care
We examined inpatient healthcare use in the last year of life using the following measures: number of hospital admissions, total length hospital stays (in days), number of A&E admissions, ICU admissions, length of ICU stay (in days) and number of supported organs while in ICU. The costing of inpatient hospital care was based on Healthcare Resource Group (HRG), a classification system of clinically similar admissions that use common levels of healthcare resources used for reimbursement of healthcare services.22 We used national schedules of reference costs (2010–2017) to assign a cost to each HRG. The costs are based on national average unit costs provided for each service.23 We matched HRGs with reference costs for each year and if costs were not available on national schedules of reference costs, tariffs were used. For A&E, we used 2017 reference costs.
Outpatient care
Outpatient data included information on services provided in the outpatient clinic setting, including the treatment specialty. We examined the number of outpatient appointments per participant and their associated costs. Costs for outpatient appointments were derived from national schedules of reference costs, which are based on national average unit costs provided for each service (service code).
Primary care contacts
Primary care contacts were identified using the consultation file, which contains information relating to the type of consultation entered by GPs including GP consultations, out-of-hours consultations, telephone consultations, home consultations and day case consultations. The costs were obtained from standard reference sources including the Personal Social Services Research Unit Costs of Health and Social Care 2015 report.24
Prescriptions
The number and details of primary care prescriptions were obtained through the therapy data set. We utilised prescription cost analysis (PCA), which provides details of the number of items, and the net ingredient cost of all prescriptions dispensed in the community in England. Prescriptions were classified according to their British National Formulary chapter subparagraph, and the mean subparagraph cost was attached according to the England PCA.25
Statistical analysis
We calculated means and SD for the use of each dimension of healthcare service and total cost in the last year and last month of life. We documented healthcare use by region and IMD quintile (lowest and highest IMD equating to most and least deprived categories, respectively). Missing values of cost were imputed based on gender, age and cause of death. We relied on Poisson regression to estimate the independent effects of age, gender, comorbidity burden, cause of death, region and IMD on healthcare use (ie, hospital admissions, primary care contacts) and we used generalised linear models to study factors associated with costs, including interactions between age and gender, as well as age and cause of death. Data management and analysis were conducted using Stata V.15 (StataCorp).
Patient and public involvement
Patients and public were not involved in the design and conduct of this research.
Results
Patient characteristics
Our final sample consisted of 108 510 participants aged 60 years and over, who died between 2010 and 2017(table 1). The coverage of CPRD varies by regions, giving rise to under-representation and over-representation of some regions.26 The majority of decedents (88%) were over 75 years and 55.7% were female. The mean age at death was 84.6 years. The most common primary causes of death were circulatory and cardiovascular diseases (27.1%), cancer (23.4%), respiratory diseases including COPD (15.0%) and dementia (10.8%). The proportion of participants with 1–3 comorbidities was 39.1%
Characteristics of study population
Healthcare utilisation
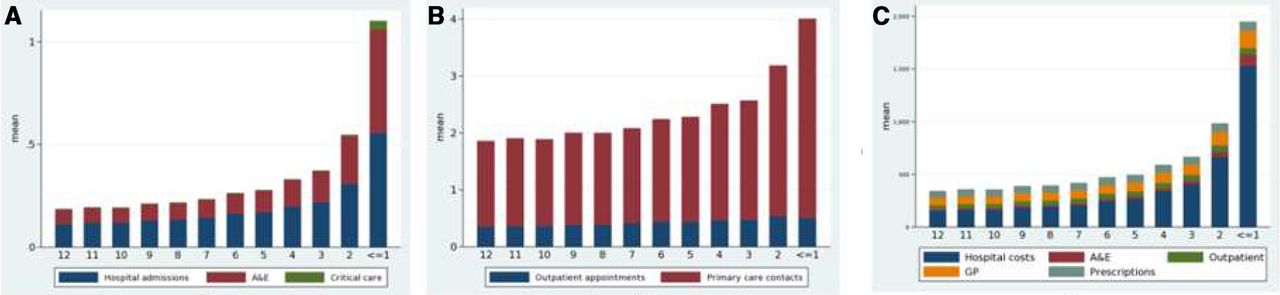
Figure 2 A,B shows healthcare utilisation by care setting. Healthcare service use increased significantly over the last 12 months of life, rising sharply in the last month of life.

Healthcare utilisation and costs in the last 12 months of life. (A) Use of inpatient care. (B) Primary and hospital outpatient care. (C) Total costs by cost type. A&E, Accident & Emergency, GP, general practitioner.
Of all study participants, 78% were hospitalised at least once in the last year of life (table 2). Overall, the mean number of hospital admissions the last year of life was 2.4 (SD: 5.9) and 0.6 (SD: 0.9) in the last month of life. The mean number of hospital bed days in the last year life was 23.3 (SD: 31.9) and 4.7 (SD:9.1) in the last month of life. Younger decedents, males, those with more comorbidities, the most socioeconomically deprived and those living in London had a higher mean number of hospital admissions and hospital days in the last year and last month of life. Cancer decedents had higher mean of hospital admissions in the last year of life, while in the last month of life deaths from infectious diseases were preceded by a higher mean of hospital admissions and hospital days (online supplemental files 2 and 3).
Healthcare utilisation in the last 12 months and in the last month of life
Over 74% of decedents had at least one A&E admission in the last 12 months of life and 43% in the last month of life. Overall, the mean number of A&E admissions in the last 12 months of life was 1.7 (SD: 1.8) and 0.5 (SD: 0.6) in the last month of life. Younger decedents, males, with more comorbidities and those who were the least socioeconomically deprived and London region had higher number of A&E admissions in the last 12 months and last month of life (online supplemental files 2 and 3).
Among those admitted in the last year of life, they attended ICU on average 1.0 times (SD: 0.2) and the mean ICU LOS was 6.7 days (SD: 10.0). 66.8% of decedents had at least one outpatient appointment in the last year of life. Decedents had, on average, 5.1 (SD: 11.9) outpatient appointments in the last 12 months of life. Males, younger decedents, cancer deaths, those with more comorbidities and the most socioeconomically deprived had higher mean numbers of outpatient appointments in the last year and last month of life. (online supplemental files 2 and 3).
The majority (86.8%) of decedents had at least one primary care contact in the last year of life. Decedents had an average of 19.8 (SD: 17.6) GP consultations in this period and 2.8 (SD: 3.0) in the last month of life. Males, younger decedents, cancer deaths, those with more comorbidities, those in the North-East and South-East regions had a higher mean number of primary care contacts in the last 12 and last month of life. Over 80% of decedents had at least one prescription filled by GP in the last 12 months. Overall, utilisation varied only slightly with socioeconomic deprivation (online supplemental files 2–5).
Healthcare costs
Figure 2C shows total healthcare costs by cost type and time to death. Costs increased significantly in the last month of life. Online supplemental file 4 outlines mean total costs by age, gender, cause of death, comorbidity, IMD and region. Costs were higher among males (£8089) compared with females (£6898) and declined with age at death (£9164 at age 60–69 to £5228 at age 90+). Hospital care accounted for over 60% of total costs. Inpatient healthcare costs by age, disease and time to death are shown in online supplemental files 6 and 7).
The mean A&E cost per decedent was £329, outpatient cost £545, primary care cost £1088 and prescription cost £764. Mean cost increased with the number of comorbidities (from £5431 among decedents with no comorbidity to £13 124 among those with 7+ comorbidities). Cost was higher among cancer or COPD deaths, the least socioeconomically deprived and London region.
Multivariate models
Results from the models for healthcare utilisation (online supplemental files 8–11) suggest that, except for outpatient visits, hospital admissions, primary care contacts and A&E visits increased sharply in the last month of life. The use of healthcare (particularly hospital use) declined significantly with age and increased with the number of comorbidities.
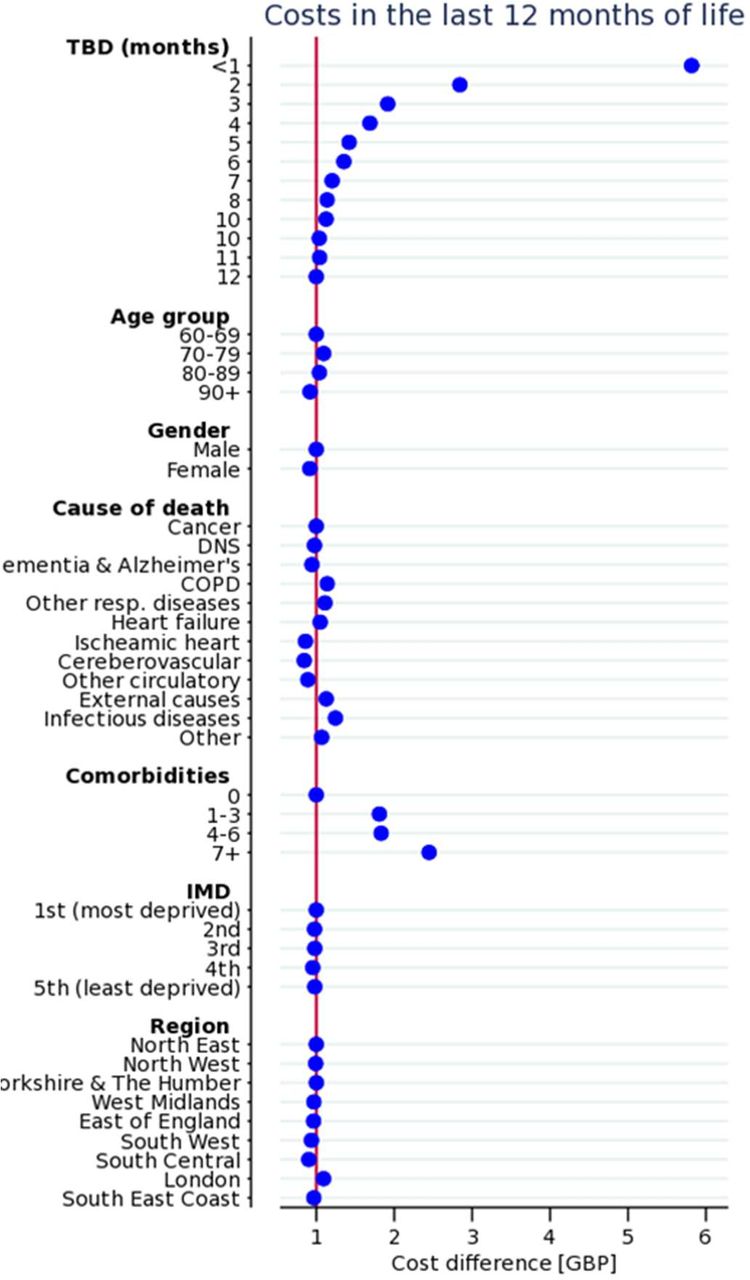
The main drivers of costs are proximity to death and comorbidity burden (figure 3). Models also suggest that costs decline with age at death (0.92, 95% CI 0.88 to 0.95, p<0.0001 for age group 90+ compared with to the reference category 60–69) and were lower among females (0.91, 95% CI 0.90 to 0.92, p<0.0001 compared with males).

General linear model: healthcare costs in the last 12 months of life. COPD, chronic obstructive pulmonary disease; IMD, Index of Multiple Deprivation.
Models for healthcare utilisation and costs reveal regional variation as shown in figure 4. For instance, costs in the last year of life were higher (1.09, 95% CI 1.01 to 1.14, p<0.0001) in London compared with other regions. In the last months of life, costs were higher in Yorkshire and The Humber (1.17, 95% CI 1.08 to 1.26, p<0.0001) and London (1.10, 95% CI 1.03 to 1.18, p<0.002). The South-West has relatively low costs and hospitalisations compared with the other regions and has the highest number of primary care contacts.

Models of healthcare utilisation and costs in the last 12 months of life across regions.
Discussion
Main findings
We assessed the intensity of services received in the last year of life using a large patient-level linked dataset covering primary care, outpatient and inpatient care. As previously documented,9 27 healthcare utilisation and costs in the last year of life increase with proximity to death, particularly in the last month of life. The main driver of healthcare intensity and costs is inpatient hospital care, although we also observe a marked increase in A&E visits and primary care contacts in the last month of life. Our results suggest that healthcare utilisation and costs decrease with age at death, and are higher in men, patients dying from cancer and patients with high comorbidities. Analysis of regional variation, although based on a small number of large regions, reveals that hospital admissions and associated costs are higher in London, and that there might be some substitutability between primary care and inpatient care. We did not observe great variation in healthcare use and costs across IMD, contrary to previous evidence in patients with cancer.28
Strengths and limitations
The main strength of this study is that we exploit a rich patient-level dataset covering both primary and secondary care activity and related costs. The size of the dataset allowed us to study variation in healthcare use and cost trajectories by cause of death, IMD and region. Another strength is that it was conducted in tandem with a Scottish study thereby enabling comparisons between the two countries, both in terms of end-of-life care trajectories and in terms of data availability. Specifically, both datasets differed in terms of breadth and depth. For instance, while our analysis relied on a sample of practices, the analysis in Scotland exploited data for the whole country and used measures of rurality that were not available in England. However, the Scottish data were more limited in scope as it did not include primary care activity. Overall, conducting the two studies with different datasets make common findings more robust, while allowing complementary insights into specific determinants.
We acknowledge several limitations to our study. As in all observational research, our study is subject to biases. Our analysis was restricted to CPRD general practices in England that participated to HES data linkage over the whole study period, that is, 2010–2017. Participating practices may be different from the average practice. For instance, very low number of patients were observed in some regions (eg, North East), our data are, therefore, not necessarily representative at the region level. Conversely, South East Coast is over-represented compared with other regions. Several factors may potentially increase GP participation in primary care data collection including younger age, males, urban location and type of practice.29 30 Another limitation is that despite having access to rich primary care and hospital level data, we were not able to assess utilisation and costs of health and social care in other settings. In particular, we were not able to identify use/needs of palliative care using our primary care data due to very low number of relevant codes indicating potential incomplete coding in this area.
We had no data related to living circumstances and either formal or informal social care support (eg, whether decedents lived in care homes or in their own homes with packages of care, whether they lived alone or had partners or family carers). Such services are likely to affect who needs hospital-based care towards the end of life. We did not have information on the availability, accessibility and use of palliative care services, hospice beds, or anticipatory care planning. While we were able to measure comorbidities, this was only captured in hospital data. Also, we did not have measures of patient frailty, which is well recognised as an important determinant of care requirements and risk of death. Finally, while we were able to measure activity and costs, the use of administrative data does not allow us to assess appropriateness of services used, and whether these align with patient preferences.
What this study adds
Our results are in line with previous U.K studies on healthcare use and costs in the last year of life that found high costs and inpatient activity in the last year of life and that highlighted the role of proximity to death, age at death and comorbidity.9 27 31–34 Our findings are in line with measures of hospital use reported in a study comparing outcomes in seven countries.34 Our main contribution is the analysis of both costs and healthcare use, including primary care, for all decedents, when previous studies often focused on inpatient care and/or patients with cancer. We have shown that it is not only the condition that is the direct cause of death, but also the comorbidities individuals have, which impact their healthcare usage. Secondary care is often led by a single specialty (eg, oncology) and this may come at the expense of a more holistic view. Models of supportive care that attend to the spectrum of conditions that people may be living with/dying from are needed. Less intensive and aggressive, end-of-life care potentially community-based, may be desirable for most individuals, and may lead to systems cost savings. However, if optimum patient care is to be provided, such a shift away from secondary care should be accompanied by investments in alternative care arrangements such as enhanced community palliative care provision and support for families and carers. Advance care planning (ACP) discussions and records can usefully inform transitions in care between acute hospitals and the community, particularly with regard to realistic goals of care. Given the scale of hospital admissions and discharges demonstrated in our study, increasing the uptake and quality of ACP is recommended. We are currently examining experiences of ACP conversations and their perceived value in an interview-based study of bereaved family members.
Future research
Future research should include more information on the social situation of decedents, including place of residence and whether carers are supporting at home. Also, finer geographical data and more information on healthcare supply and organisation would allow further investigating whether people receiving more planned care by primary care and or specialist palliative care towards the end of life require less acute care. Also, place of death as a key outcome in end-of-life care was not available at time of data extraction and we plan to complement the analysis by focusing on place of death as an outcome.
Overall, several questions remain unanswered when relying essentially on administrative data, that is, how are decisions made about the right kind of care by clinicians? What needs drive acute hospital care at the end of life? To what extent is availability of alternative options to hospital important? What is the value of primary care and hospital-based care for people living with advanced illness? Such ‘Big Data’ analysis should, therefore, be complemented by qualitative work. The findings from this study provide a foundation for qualitative work, which is essential to understand the lived experience of service users and those close to them, but also views of clinicians and policy-makers.
Conclusion
Primary and secondary care use and associated costs increase sharply in the last year of life in England, and there is heterogeneity in care trajectories by cause of death and region of residence. Further quantitative and qualitative work is needed to better understand drivers of the variation described in this study.
Acknowledgments
The authors would like to thank members of the advisory board Julia Riley, Sandra Campbell Catherine Urch, Bee Wee, Harry Quilter-Pinner, Ivor Williams and Gianluca Fontana for their valuable feedback, Bastien Trächsel for his assistance with maps and CPRD for providing the data used in the study.
References
Supplementary materials
Supplementary Data
This web only file has been produced by the BMJ Publishing Group from an electronic file supplied by the author(s) and has not been edited for content.
Footnotes
Contributors JM led the conception and design of the study. XL conducted data management and analysis supported by KS, DH and JM. XL, JM, KD, JB, JD, VR and PH were involved in data interpretation. XL drafted and revised the article. JM, JB and VR critically reviewed and edited the draft article. All authors read and approved the final version of the manuscript.
Funding This work was supported by the Health Foundation (www.health.org.uk). The funders had no role in study design, data collection and analysis, decision to publish or preparation of the manuscript.
Map disclaimer The depiction of boundaries on the map(s) in this article does not imply the expression of any opinion whatsoever on the part of BMJ (or any member of its group) concerning the legal status of any country, territory, jurisdiction or area or of its authorities. The map(s) are provided without any warranty of any kind, either express or implied.
Competing interests None declared.
Patient consent for publication Not required.
Ethics approval Our study was approved by the Independent Scientific Advisory Committee for MHRA database research (ISAC protocol #18_049R).
Provenance and peer review Not commissioned; externally peer reviewed.
Data availability statement Data may be obtained from a third party and are not publicly available.