Article Text

Abstract
Objective The ‘surprise question’ (SQ) and the palliative care screening tool (PCST) are the common assessment tools in the early identification of patients requiring palliative care. However, the comparison of their prognostic accuracies has not been extensively studied. This study aimed to compare the prognostic accuracy of SQ and PCST in terms of recognising patients nearing end of life (EOL) and those appropriate for palliative care.
Methods This prospective study used both the SQ and PCST to predict patients’ 12-month mortality and identified those appropriate for palliative care. All adult patients admitted to Taipei City Hospital in 2015 were included in this cohort study. The c-statistic value was calculated to indicate the predictive accuracies of the SQ and PCST.
Results Out of 21 109 patients, with a mean age of 62.8 years, 12.4% and 11.1% had a SQ response of ‘no’ and a PCST score of ≥4, respectively. After controlling for other covariates, an SQ response of ‘no’ and a PCST score of ≥4 were the independent predictors of 12-month mortality. The c-statistic values of the SQ and PCST at recognising patients in their last year of life were 0.680 and 0.689, respectively. When using a combination of both SQ and PCST in predicting patients’ 12-month mortality risk, the predictive value of the c-statistic increased to 0.739 and was significantly higher than either one in isolation (p<0.001).
Conclusion A combination of the SQ with PCST has better prognostic accuracy than either one in isolation.
- hospice care
- supportive care
Statistics from Altmetric.com
Introduction
The WHO estimates that 40 million patients with cancer and other life-limiting diseases need palliative care, yet only 14% receive it.1 According to the WHO definition, palliative care should be initiated in an early phase and not be restricted to terminal care.2 Early identification of patients nearing end of life (EOL) is important to provide palliative care services for those in need of it. Previous reports showed that early identification of patients needing palliative care could meet patients’ goals of treatment and improve the quality of EOL care.3 4However, early identification of patients nearing EOL and those needing palliative care is a challenge for healthcare systems. Previous reports showed that clinicians are inaccurate at prognostication and in recognising dying patients.5 6
The ‘surprise question’ (SQ) has been used as a trigger in the early identification of patients needing palliative care.7 It simply asks whether the respondent would be surprised if the patients were to die within the next 6–12 months.8 As the SQ does not require clinicians to collect patients’ clinical data or to use a complex scoring algorithm, it has been widely used in assisting healthcare practitioners at recognising patients nearing EOL and those appropriate for palliative care.9 10 However, a recent review article showed that the accuracy of SQ varied by study population, ranging from a poor to a reasonable accuracy.11
The palliative care screening tool (PCST) is another assessment method assisting clinicians in the early identification of patients nearing EOL and in need of palliative care.12–14 PCST collects patients’ clinical data (eg, functional status and comorbidities) and uses a scoring algorithm to make an estimate about their length period of survival.13 14 Although SQ and PCST are the common assessment tools assisting healthcare providers in identifying patients appropriate for palliative care, the comparison of their prognostic accuracies has not been extensively studied.11 Moreover, it is unclear whether a combination of SQ with PCST would have a better prognostic accuracy than either one being used in isolation.11 A previous Spanish cohort study followed 1064 patients with advanced chronic conditions to compare the validity of the Necesidades Paliativas (NECPAL) tool and SQ in the prediction of their mortality.15 This study showed that the prognostic accuracies of SQ and NECPAL were 52.9% and 55.2%, respectively.15
Early identification of patients nearing EOL could provide a greater opportunity in offering the palliative care services. Understanding the validity of SQ and PCST in recognising patients nearing EOL could guide future palliative care policies to more accurately screen for peoples’ palliative needs. The goal of this cohort study is to compare the prognostic accuracy of SQ and PCST at recognising patients nearing EOL. We hypothesised that a combination of SQ with PCST would have a better prognostic accuracy than either one being used in isolation.
Methods
Study participants
Taipei City Hospital (TCH), since 2015, has implemented a palliative care programme to early identify patients needing palliative care and to provide advance care planning (ACP) meetings for the patients.16 When patients are admitted to TCH, they are evaluated for the needs of palliative care using the PCST (online supplementary table S1)17 and SQ. If patients’ PCST score is 4 points or greater, they are informed about ACP meetings to discuss their preference regarding EOL care.18 ACP meetings are also informed for patients nearing EOL or who would not surprise nurses by dying in the next 6–12 months. To improve patients’ palliative care and promote ACPs, TCH has held a series of palliative training programmes for all healthcare providers since 2015.19
Supplemental material
This study included participants aged 18 years or older and admitted to TCH in 2015. All patients were followed up until death or the end of 2016. The data for this study were obtained retrospectively from patients’ medical records.
Outcome variable
The primary outcome of this study was the 12-month mortality risk of patients. Deaths were confirmed by examining the Taiwanese death certificate database.20
Main explanatory variable
The main explanatory variables were the SQ and PCST score. We collected the nurses’ responses to the SQ, ‘Would I be surprised if this patient died in the next 6–12 months?’. The responses to the SQ included either ‘yes’ or ‘no’. PCST scores were categorised into <4 or ≥4 points. Our prior validity study found that the specificity of a PCST score ≥4 in predicting 6-month mortality was 91.8% among hospitalised patients.17
Controlling variables
The controlling variables included sociodemographics (eg, age and gender), comorbidities, Eastern Cooperative Oncology Group (ECOG) performance status and frequency of underlying disease exacerbations. Comorbidity was determined using the patients’ medical records, including heart failure, chronic obstructive pulmonary disease (COPD), cancer, liver cirrhosis, end-stage renal disease, dementia and bedsores. The severity of heart failure was classified into normal, mild (New York Heart Association (NYHA) class I and II), moderate (NYHA class III) and severe status (NYHA class IV).21 The COPD stage included mild, moderate and severe statuses.9 ECOG functional status was classified into five categories, ranging from grade 0 ‘fully active’ to grade 4 ‘completely disabled’.22
Statistical analysis
First, the demographic data of the study participants were analysed. Continuous data are presented as the mean (SD), and the two-sample t-test was used for comparisons between groups. Categorical data were analysed using the Pearson χ2 test, where appropriate.
The Kaplan-Meier method was used to generate survival curves, with comparisons being assessed according to the SQ responses and PCST scores of patients. Multivariate logistic regression was used to estimate the association of SQ response and PCST scores with 12-month mortality after adjusting for participants’ age, gender, comorbidities, ECOG performance status and frequency of underlying disease exacerbations. The variable with p<0.05 was defined as a significant factor associated with mortality in the multivariate analysis. Adjusted ORs (AOR) with 95% CIs were reported to show the strength and direction of these associations.
To assess the prognostic prediction of SQ and PCST scores, we calculated the sensitivity (the ability to recognise dying patients), specificity (the ability to recognise those not dying), positive predictive value (PPV) (the proportion of patients who died when the nurses predicted dying) and the negative predictive value (NPV) (the proportion of patients who survived when the nurses predicted survival).23 The c-statistic value, also known as the area under the curve, was estimated to indicate the level of predictive accuracy of SQ and PCST.24 This statistic compares the number of correct estimates (sensitivity) with the number of false estimates (1-specificity). A score of 0.5 suggests that a model has poor predictive value, meaning that nurses are no better than chance at identifying a patient nearing EOL. An increase in the c-statistic value (to a maximum score of 1) indicates an increase in the level of predictive accuracy. A good predictive model requires the c-statistic score to be >0.7. The difference of c-statistic value for SQ, PCST and the combination of SQ with PCST was compared from different logistic regression models.25 All data management and analyses in this study were performed using the SAS V.9.4 and STATA V.13.0 software package.
Results
Participant selection
This cohort study included 23 444 patients who were admitted to TCH and were evaluated for the needs of palliative care in 2015. After excluding those younger than 18 years (n=2128) and those with incomplete data (n=207), the remaining 21 109 subjects were included in the analysis. The overall mean (SD) age was 62.8 (19.0) years and 53.2% of the subjects were male. Of all study subjects, 2626 (12.4%) individuals received a ‘no’ in answer to the SQ, and 2349 (11.1%) subjects had a PCST score ≥4.
Characteristics of patients evaluated by SQ
Table 1 shows the characteristics of patients according to their SQ response. When compared with patients with an SQ response of ‘yes’, those with a ‘no’ response were older (75.0 vs 61.7 years). Moreover, patients with SQ responses of ‘no’ had higher proportions of comorbidities, higher grades of ECOG performance status and higher frequencies of disease exacerbations. The proportion of patients with PCST scores of ≥4 were 48.59% and 5.81% in those with SQ responses of ‘no’ and ‘yes’, respectively. Moreover, 24.12% of patients with an SQ response of ‘no’ had undergone ACP communications with healthcare providers, with only 4.64% of patients with SQ responses ‘yes’ receiving the same communication.
Patients’ characteristics by surprise question response
Mortality rates by SQ and PCST
During the follow-up period, 1754 patients died within 12 months of palliative care screening, including 799 (30.50%) individuals with SQ responses of ‘no’ and 955 (5.17%) patients with SQ responses of ‘yes’. The proportion of 12-month mortalities were 34.14% and 5.06% in patients with PCST scores of ≥4 and <4, respectively. While using a combination of SQ with PCST to predict patients’ mortality risk, 28.01% of patients with SQ responses of ‘no’ or PCST scores of ≥4 died within 12 months. Conversely, only 4.11% of patients with SQ responses of ‘yes’ and PCST scores of <4 died in 12 months. Time to death was significantly shorter in patients with SQ responses of ‘no’ when compared with those with ‘yes’ responses (p<0.001, log-rank test; figure 1). When compared with patients with PCST scores of <4, the mortality rate was significantly higher among those with scores of ≥4 (p<0.001, log-rank test). Furthermore, time to death was significantly shorter in patients with SQ responses of ‘no’ or PCST scores of ≥4 when compared with those with ‘yes’ responses and scores of <4 (p<0.001, log-rank test).
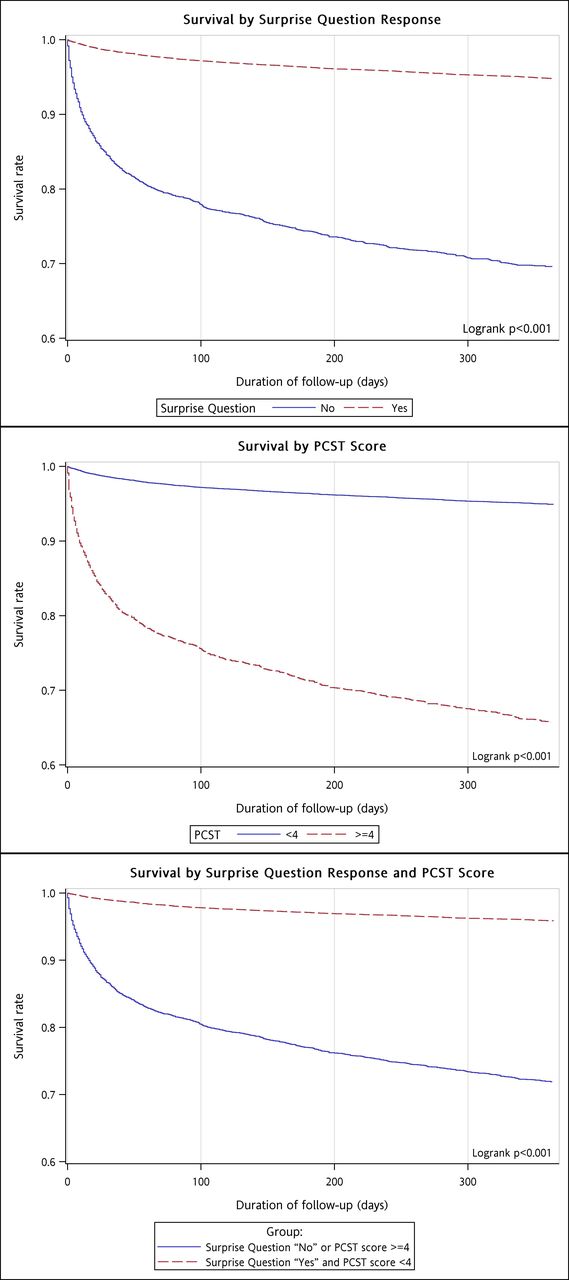
Patients’ survival rate by surprise question response and palliative care screening tool (PCST) scores.
Factors associated with 12-month mortality among patients receiving palliative care screening
Multivariate logistic regression was used to identify the independent risk factors for 12 month mortality in patients receiving palliative care screening. After controlling for demographics, ECOG performance status and comorbidities, patients with SQ responses of ‘no’ had a significantly higher risk of 12-month mortality compared with those with a ‘yes’ response (AOR=2.30; 95% CI 2.03 to 2.62; p<0.001) (table 2). Moreover, a PCST score of ≥4 was associated with a higher risk of 12-month mortality (AOR=1.43; 95% CI 1.21 to 1.70; p<0.001). The independent risk factors for 12-month mortality were an age ≥65 years, being male, having a higher grade of ECOG performance status, moderate or severe heart failure, moderate or severe COPD, cancer, liver cirrhosis, end-stage renal disease and having been hospitalised more than once for the same diagnosis in the last 30 days.
Univariate and multivariate analyses of factors associated with 12-month mortality among patients
While using a combination of SQ with PCST to predict patients’ mortality risk, those with an SQ response of ‘no’ or PCST scores of ≥4 had a significantly higher risk of 12-month mortality compared with those with ‘yes’ responses or scores <4 (AOR=2.01; 95% CI 1.73 to 2.32; p<0.001) (table 3).
Association of surprise question and palliative care screening tool with 12-month mortality among patients
Accuracy of SQ and PCST in predicting patients’ 12-month mortality
Table 4 shows the accuracy of the SQ and PCST at recognising patients in their last year of life. The sensitivity, specificity, PPV and NPV of the SQ were 45.5%, 90.6%, 30.4% and 94.8%, respectively, with the c-statistic=0.680. Moreover, the sensitivity, specificity, PPV and NPV of the PCST were 45.8%, 92.0%, 34.1% and 94.9%, respectively, with the c-statistic=0.689. When a combination of SQ with PCST was used for the prediction of patients’ 12-month mortality, the sensitivity, specificity, PPV and NPV were 59.2%, 86.2%, 28.0% and 95.9%, respectively. Furthermore, the predictive value of the c-statistic by using a combination of both SQ and PCST increased to 0.739 and was significantly higher than either one in isolation (p<0.001).
Accuracy of SQ and PCST in predicting patients’ 12-month mortality
Discussion
In this cohort study of 21 109 patients, 1751 (8.30%) individuals died within 12 months of palliative care screening. After adjusting for demographics, ECOG performance status and comorbidities, an SQ response of ‘no’ and a PCST score of ≥4 were found to be the independent predictors for patients’ 12-month mortality. While using a combination of SQ with PCST to predict patients’ mortality, the prognostic accuracy was significantly better than either tool being used in isolation.
Early identification of patients nearing EOL could provide greater opportunities for offering palliative care services for those in need of palliative treatment. SQ and PCST are the screening tools assisting healthcare providers in predicting patient outcomes, as well as identifying early on those in need of palliative care.11 12 26 However, the comparison of the validities of SQ and PCST has not been extensively studied. A Spain cohort study included 1064 patients with advanced chronic diseases and found that the prognostic accuracy of SQ and NECPAL tool was 52.9% and 55.2%, respectively.15 Our study followed 21 109 patients and found that the prognostic accuracies of SQ and PCST were 68.0% and 68.9%, respectively. When using a combination of SQ with PCST to predict patients’ mortality risks, the prognostic accuracy of the combined screening tool was increased to 73.9%. As early identification of people nearing EOL could create greater opportunities for providing palliative care services, as well as improve their quality of EOL care,3 our study suggests that it is imperative to screen patients’ palliative needs via highly accurate screening tool.
This study found that a combination of the SQ with PCST has better prognostic accuracy than either one in isolation. Of patients who died in the next 12 months, 59.2% were identified by using a combination of the SQ with PCST. However, the PPV using a combination of the SQ with PCST decreased to 28.0% compared with 30.4% for SQ and 34.1% for PCST. When the TCH initiated a large-scale palliative care programme for early identification of patients in need of palliative care, ACP meetings were held for patients nearing EOL.27 Physicians, nurses and social workers were required to attend the ACP meeting. The duration of each ACP meeting with patients was required to last for at least an hour.27 Although a combination of the SQ with PCST could identify more patients who will die in the next 12 months, future studies are needed to determine the balance between patients’ benefits from early identification of palliative care and the cost of ACP meeting.
There are two strengths in our study. First, our study was the first large-scale study to compare the prognostic accuracy of SQ and PCST at recognising patients in their last year of life. Our study found that a combination of SQ with PCST had better prognostic accuracy than either tool being used in isolation. Our study suggests that a combination of SQ with PCST can identify more patients needing palliative care and could be incorporated into routine clinical practice. Second, although palliative programme to early identify patients in need of palliative care is not common in Asia,28 our study suggests that it is practical to incorporate a palliative screening programme into the existing healthcare system to early identify patients in need of palliative care.
Nonetheless, two limitations should be considered in interpreting our findings. First, the SQ was completed by the nurses in this study. Although a previous report found that SQ used by the nurses was effective in identifying patients nearing the EOL,9 future studies are needed to compare the accuracy of PCST and SQ used by the doctors at recognising patients nearing the EOL. Second, the external validity of our findings may be a concern because almost all our enrolees were Taiwanese. The generalisability of our results to other, non-Asian ethnic groups thus requires further verification.
Conclusions
This population-based cohort study found that an SQ response of ‘no’ and a PCST score of ≥4 were the independent predictors for 12-month mortality in patients. While using a combination of SQ with PCST to predict patients’ mortality, the prognostic accuracy was significantly better than either tool being used in isolation. As the early identification of patients in need of palliative care could meet patients’ goals of treatment and improve the quality of EOL care, it is imperative to screen patients’ palliative needs by using a highly accurate screening tool.
Ethics statements
Patient consent for publication
Acknowledgments
The authors are grateful to the members of the Research Office for Health Data, Department of Education and Research, Taipei City Hospital, Taiwan, for their valuable contributions in data management and statistical analysis.
References
Footnotes
Y-FY, Y-LL and H-YH contributed equally.
Contributors All authors substantially contributed to the conception and design of the study, data analysis, data interpretation and the drafting of the manuscript. Y-FY, Y-LL, H-YH, W-JS, M-CK, C-CC, W-KW, S-JH and DC substantially contributed to data acquisition and interpretation of the results. All authors approved the final version of the manuscript.
Funding This study was supported by a grant from the Department of Health, Taipei City Government, Taiwan. The study sponsor was not involved in the study design, the collection, analysis, or interpretation of the data, the writing of this report, or the decision to submit it for publication.
Competing interests None declared.
Provenance and peer review Not commissioned; externally peer reviewed.
Supplemental material This content has been supplied by the author(s). It has not been vetted by BMJ Publishing Group Limited (BMJ) and may not have been peer-reviewed. Any opinions or recommendations discussed are solely those of the author(s) and are not endorsed by BMJ. BMJ disclaims all liability and responsibility arising from any reliance placed on the content. Where the content includes any translated material, BMJ does not warrant the accuracy and reliability of the translations (including but not limited to local regulations, clinical guidelines, terminology, drug names and drug dosages), and is not responsible for any error and/or omissions arising from translation and adaptation or otherwise.