Article Text

Abstract
Objective To identify the relative importance of factors influencing hospital use at the end of life.
Design Retrospective cohort study of person and health system effects on hospital use in the past 12 months modelling differences in admissions, bed days and whether a person died in hospital.
Setting Residents in England for the period 2009/2010 to 2011/2012 using Hospital Episodes Statistics (HES) data from all acute care hospitals in England funded by the National Health Service (NHS).
Participants 1 223 859 people registered with a GP in England who died (decedents) in England (April 2009–March 2012) with a record of NHS hospital care.
Main outcome measures Hospital admissions, and hospital bed days and place of death (in or out of hospital) in the past 12 months of life.
Results The mean number of admissions in the past 12 months of life averaged 2.28 occupying 30.05 bed days—excluding 9.8% of patients with no hospital history. A total of 50.8% of people died in hospital. Difference in hospital use was associated with a range of patient descriptors (age, gender and ethnicity). The variables with the greatest ‘explanatory power’ were those that described the diagnoses and causes of death. So, for example, 65% of the variability in the model of hospital admissions was explained by diagnoses. Only moderate levels of variation were explained by the hospital provider variables for admissions and deaths in hospital, though the impacts on total bed days was large.
Conclusions Comparative analyses of hospital utilisation should standardise for a range of patient specific variables. Though the models indicated some degree of variability associated with individual providers, the scale of this was not great for admissions and death in hospital but the variability associated with length of stay differences suggests that attempts to optimise hospital use should look at differences in lengths of stay and bed use. This study adds important new information about variability in admissions by diagnostic group, and variability in bed days by diagnostic group and eventual cause of death.
- Terminal care
- Service evaluation
- Hospital care
This is an Open Access article distributed in accordance with the Creative Commons Attribution Non Commercial (CC BY-NC 4.0) license, which permits others to distribute, remix, adapt, build upon this work non-commercially, and license their derivative works on different terms, provided the original work is properly cited and the use is non-commercial. See: http://creativecommons.org/licenses/by-nc/4.0/
Statistics from Altmetric.com
Introduction
Care for people at the end of their lives is receiving increasing attention among patients, care providers and policymakers. End of life care can require difficult choices between care options, having to balance the possibility of a marginal benefit of treatment against the impact this may have on the quality of life for the patient and for family care givers.1–3 The last few months of life can often involve multiple hospital admissions, extended stays, and numerous consultations and referrals. This activity can be very significant in terms of its costs and has been estimated to account for as much as 10–12% of total health costs.4 ,5 In the USA, wide variation in cost of care at the end of life has been documented, with aggressive use of hospital care, intensive care bed days and multiple specialty referrals contributing to higher costs in many geographic areas and hospital care settings.6 ,7 As policymakers struggle to respond to rising healthcare costs, greater reliance on potentially less costly hospital alternatives such as hospice or home care is clearly an option.8
In England just under half a million people die each year (446 779 in 2012), with two-thirds of those dying aged 75 years or above (68.1% in 2012).9 Most deaths followed a period of chronic illness (eg, heart disease, stroke, cancer and dementia) and between 2008 and 2010 55% of deaths occurred in hospital, with 20% at home and 18% in a care home.10 In 2008 the Department of Health set out a clear strategy for improving care at the end of life, making a series of recommendations for example, to improve care planning, coordination of care, rapid access to care in all settings, training the workforce and supporting carers.11 The strategy also pointed to the crucial role of measurement and research to help monitor progress.12 A number of initiatives national and local have sought to promote better access to alternatives to hospital care at the end of life13 including National Institute for Health and Care excellence (NICE) quality standards.14
As part of the policy drive to enable more people to die in the place of their choosing, there is a widespread use of area-based measures to monitor change.10 There is, however, relatively little analysis of the factors that might influence end-of-life hospital use related to the characteristics of the patients or to those of local health systems. Differences in hospital use could potentially be due to:
The age/gender and socioeconomic status of patients
The health problems presented by the patient, and the cause of death
Features of the local health systems including common practices within individual hospital or primary care providers, and availability of alternatives to hospital care
These factors vary in the extent to which they are amenable to change and it is not known which are the most important in determining observed patterns of where people die and overall hospital activity at the end of life. Ideally, comparative indicators should seek to standardise as far as possible, for factors beyond the control of the organisation under scrutiny. For health policymakers there is a particular interest in identifying how important are those factors relating to the local provision of care services.
To help inform policymakers and practitioners on these issues, we examined patterns of hospital use in the past 12 months of life, and documented the relative impacts of these three sets of factors. We wanted to test which factors were significant predictors of hospital use and place of death.
Methods
The study analysed a cohort of people in England who died during the 3 years from 1 April 2009 to 31 March 2012. Cases were identified using a mortality data set from the Office for National Statistics. This data set included an anonymised identifier linkable to English Hospital Episodes Statistics (HES) data, as well as information on gender, and the place, cause and date of death. These data were linked to inpatient HES records from 1 April 2007 to 31 March 2012, so that we were able to reference at least 2 years of inpatient data for every person who died. The inpatient data provided information on the age, place of residence, ethnic group and registered GP practice for the individuals who had died. All data extracts were supplied by the Health and Social Care Information Centre.15 Permission to use mortality data was granted by the Office of National Statistics (ONS) under their Approved Researcher scheme.16
Records were excluded where data were incomplete or anomalous (eg, admitted to hospital after date of death). Patients with any period of residence (according to their inpatient record) in Wales during the study were excluded because hospitalisation in Wales’ hospitals is not included in the HES data set. Children aged 1 or under were excluded because end-of-life care at this age was considered to be very different in terms of end of life care. We also excluded people with no hospital records in their final year because no information was available on age, area of residence or ethnicity.
These data sets were used to develop a series of models to look at three dependent variables: number of admissions in the past 365 days of life, total number of bed days in the same period and death in hospital. The models were built using data sets constructed at person level, and used ordinary least squares regression techniques.
In calculating inpatient bed days, zero lengths of stay were converted to a 1 day length of stay. For inpatient stays spanning the end of the year look back period (ie, where the admission date was more than 365 days prior to death, but the discharge date was within the 365-day period), only days during the look back period were included. In these circumstances the inpatient stay was included in counting admissions. Death in hospital was determined using the discharge method recorded on the person's final inpatient admission stay and so excluded patients who died during the process of admission.
A range of variables were created at person level to test as independent predictors of resource use. These covered three broad areas: (1) demographic and patient characteristics (2) clinical conditions and health problems and (3) measures of health/care services supply. These independent variables are described in more detail below.
Patient characteristics
Age and gender
Derived from individual inpatient hospital records. For some analyses age was collapsed into five age bands (2–17, 18–64, 65–74, 75–84 and 85+).
Patient ethnic group
Since 2003/2004 inpatient HES episodes have recorded ethnicity using the 16 ethnic groupings employed in the England and Wales sections of the 2001 UK Census. We collapsed these into nine groupings and had an additional category for patients with missing or invalid codes. A patient's ethnic group is recorded on each individual record, and for individuals with conflicting ethnicities reported across multiple records (or missing/invalid codes in some records, but valid codes on other records), we assigned the patient to a single group in accordance with a hierarchy described in online supplementary appendix A.
Supplementary appendix
Deprivation measures
We were not able to assess deprivation at the level of individual patient so we attached a measure for the local area of residence. Information from the Index of Multiple Deprivation 2010 contained summary deprivation indicators for the more than 30 000 ‘lower super output areas’ (LSOA) in England. Information was reweighted for six domains of the Index of Multiple Deprivation excluding the health and disability domain. This was carried out using information published by Communities and Local Government (CLG).17
Population density
To identify residents in either an urban or rural setting, we constructed a measure of population density by weighting population of each LSOA in England with respect to all other LSOAs using an inverse square law in a modified gravity model.18 This was based on 2010 estimates of population from the Office for National Statistics.19
Clinical conditions/health problems
Diagnostic group
To capture information on a person's underlying health condition we created a variable for the most frequent primary inpatient diagnosis in the last year of life. Diagnoses were grouped into 147 categories based on three-character International Classification of Diseases, Revision 10 (ICD10) code subchapters as used in reporting by Health and Social Care Information Centre (HSCIC).20 Those without a diagnosis were also grouped together, making 148 diagnosis categories in total.
Cause of death
A variable for the underlying cause of death was based on the ICD10 code for cause of death provided by the ONS data. Causes of death were grouped into categories based on the three-character ICD10 code subchapters used by HSCIC.20
Long term conditions
Long-term conditions markers were used as a measure of underlying morbidity. People were assigned to each of the long-term condition groupsi where a relevant ICD10 code was recorded on any inpatient episode in the penultimate year before death. Each specific long-term condition was used as an independent variable, in addition to the total number of different long-term conditions.
Health and care services measures
GP characteristics
Information on GP practice characteristics (the number of whole time equivalent GPs and the total registered population for 2010) was obtained from the Health and Social Care Information Centre which undertakes a census of general practices each year22 (General and Personal Medical Services statistics).
Nursing/care home bed supply
Information on number of nursing and residential care beds was derived from summary data sets supplied by the Care Quality Commission (CQC). These identified the location, size and type of all care homes and hospices registered with CQC in June 2013 at the local authority level. We constructed a measure of the density of residential beds per person (at LSOA level) using a modified gravity model.
Predominant hospitals
People were assigned to a predominant hospital based on the hospital where the patient had the most admissions in the year before death. For patients where two or more hospitals had equal most admissions, assignment was based on most frequent day case and outpatient use. Where no hospital was predominant based on admissions, day cases, and outpatient use, the patient was assigned to the hospital with the most recent admission.
Results
There were in total 1 385 103 records for people who died between 1 April 2009 and 31 March 2012. 161 244 (11.6%) of these records were excluded from analysis because of poor data (table 1). The largest group of exclusions (9.57%) was for those people with no record of any hospital activity in the final year of life which had to be excluded as we had no information about them to use in our models. This left a cohort of 1 223 859 individuals.
Exclusions from study cohort
Almost two-thirds of the final study cohort were over 75 years old, 51% were female and 89% had their ethnicity recorded as white (see table 2). No member of the study cohort was missing age information and less than a tenth of people had missing ethnicity, these people were categorised as having ‘unknown’ ethnicity and were included in subsequent analysis.
Key characteristics of the cohort
Overall the cohort had an average of 2.28 hospital admissions, accounting for 30.1 bed days in the final year of life (see table 3). A total of 51.3% died in hospital. If the 9.6% of people with no hospital history were included the average values in the past 12 months of life were 2.1 admissions, 27.1 bed days and with 4.63% dying in hospital.
Summary statistics for model performance
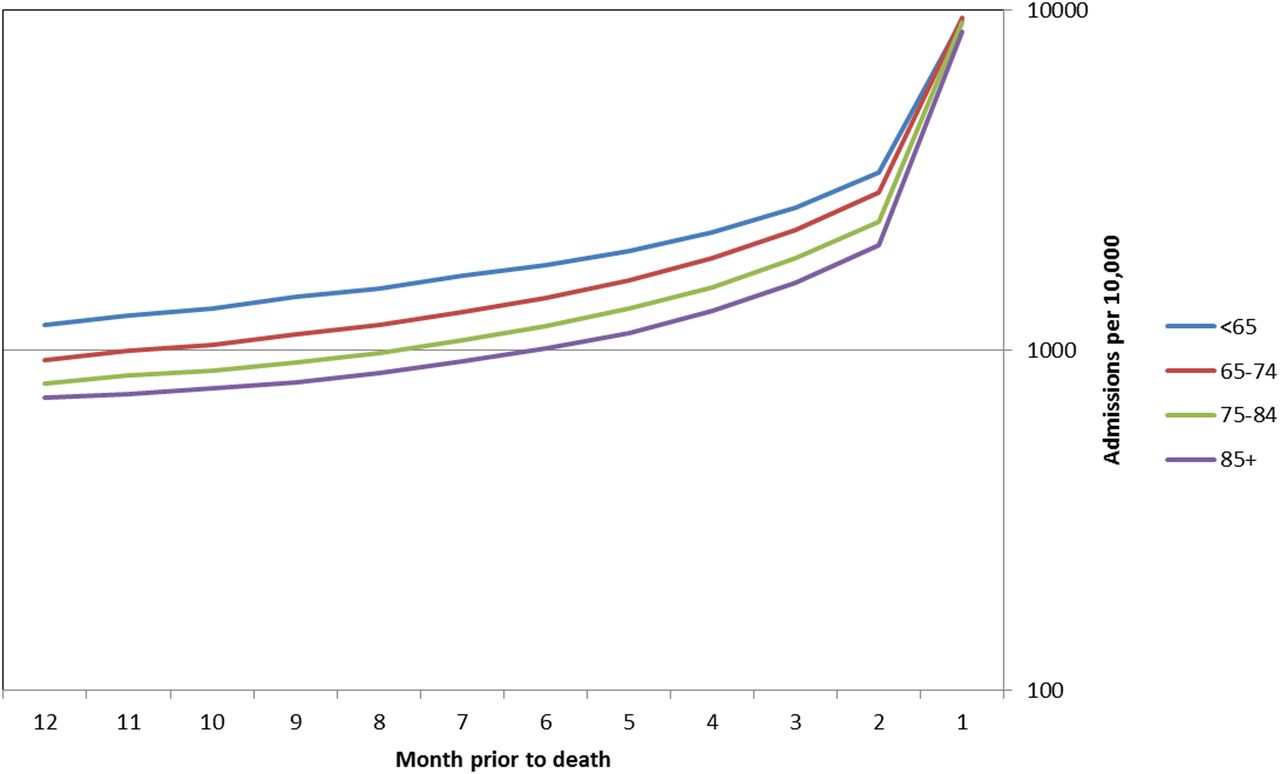
Figure 1 summarises trends in hospital admission (in this case based on dates of discharge) for specific age bands over the final 12 months of life. This demonstrates the sharp increase in hospital activity over the past 3 months of life. These past 3 months accounted for 57.0% of total admissions in the final year.

Admissions per 10 000 people, per month prior to death (note log scale).
There were major differences in patterns of hospital use in the past 12 months of life according to the age of the patient at death (see figure 2). Younger patients had higher admission rates in the last year of life, but shorter stays in hospital and were less likely to die in hospital.

Average number of admissions and bed days in the last 365 days of life and proportion dying in hospital by age at death (expressed relative to cohort mean).
Table 3 summarises the performance of the three regression models in explaining variability and shows the average admissions and bed days, and the proportion who died in hospital. Each of the models we constructed showed some explanatory power as indicated by the reduction in variability in the outcome variable, as evidenced by the decrease Root Mean Square Error (RMSE) and coefficient of variance (CV). There was greatest variability in the models for bed days before or after adjustment. Indeed, the adjusted bed days model only decreased the CV by 0.082 (compared to 0.118 for deaths in hospital), and it had the lowest r2. The best performing model in terms of explanatory power was the one that aimed to predict death in hospital which was able to explain 21.9% of the variability.
Within each model the individual coefficients were significant for the majority of variables (details in online supplementary appendix B). Table 4 summarises the explanatory power of various groups of variables in terms of the reduction in variance associated with each variable group—this effectively compares the variance with and without that set of variables in the model. The impacts of these variable groups varied between the different models. For example, age was an important explanatory variable in relation to the numbers of admissions, accounting for 11.1% of explained variation, though much less important when looking at whether a person died in hospital (0.7%) or total bed days (0.4%).
Explanatory power of different sets of variables on admission in the last year of life, bed days and deaths in hospital
Ethnicity was also one of the more influential variable groups. There were significant differences in hospital use between ethnic groups that seemed to impact on levels of admission and bed days—but less so when looking at whether a person died in hospital. Some non-Caucasian groups had higher admission rates in the last year of life, more bed days, and were more likely to die in hospital. When compared to the white groups, non-Caucasian ethnic groups had higher levels of admissions (8% higher) and bed days (9% higher), with less variance in the percentage dying in hospital (4% higher). There were also differences between the non-Caucasian ethnic subgroups.
We did see some association with the deprivation scores for the lower super output area where the person lived and greater levels of hospital activity but the effects were not strong once other factors were taken into account.
The largest explanatory power in all three models was linked with the set of diagnostic groupings which collectively explained 65% of the variation in admission and just over half the variation in bed days and deaths in hospital. The individual coefficients for almost all diagnostic groups were positive and significant indicating that the presence of diagnoses in the year before admission was associated with more hospital use. The cause of death was less powerful as an explanation of differences in hospital admission and bed days, but was more strongly linked with patients dying in hospital.
In contrast the Charlson Comorbidity Index and the count of long terms conditions were positively associated with higher hospital activity and costs but had much less impact than the diagnostic groups.
The impacts of factors in the local health systems seemed to be relatively modest, except in the case of a person's predominant hospital in the last year of life. The GP variables did not seem to be influencing hospital use to any greater extent. The number of care home and hospice beds in the local area was negatively associated with hospital activity—areas with more care home and hospice places tended to have fewer hospital admissions. Though the variable itself was statistically significant it did not seem to explain a high level of variability on the data compared to other factors. The total variability linked with the provider hospital variables collectively was around 8% for admissions, and nearly 29% for bed days. However, in the vast majority of cases individual provider effects were not statistically significant.
Discussion
Hospital use at the end of life is important in terms of the overall quality of healthcare delivery. This analysis of a large cohort of people who died has helped to outline some of the key factors influencing resource use at this critical part of the care pathway.
Financial pressures on health systems will inevitably lead to closer examination of the appropriateness of where people are treated. This tendency has become especially significant in discussions over end of life care. Our analysis demonstrates for a very large group of decedents that hospital use in the past 12 months of life is significant in terms of resource use, with an average of 2.3 admissions and 30 bed days for every person that died. Our cohort did exclude 9.6% of cases with no hospital records, but even if these had been included in the denominators the average resource use would still have been substantial. We also noted how hospital use is especially marked in the past few weeks of life with 57% of all admissions being in the past 3 months.
Our analysis highlights the significance of the role of clinical case types in understanding variations, with existing health problems and the ultimate cause of death being particularly important in explaining differences in levels of care at the end of life.
Differences in patterns of hospital use by age underscore the importance of adjusting rates for age when examining variations in relation to other variables such as ethnicity, predominant hospital or geographic area. There could be a number of reasons why differences by age persist even after adjustment for other variables. For example, younger patients are likely to have greater availability of support for care outside the hospital resulting in shorter stays. Some factors are more difficult to explain—differences linked with ethnicity for example may be an indication that some cultural and religious factors may influence utilisation. Other studies have observed differences in access to palliative care by ethnic group.23 The residual differences among ethnic subgroups are described in more detail in an accompanying study.
Though it is often assumed that the individual provider hospital may be an important factor in explaining differential patterns of hospital use at the end of life—we found that the impacts were relatively small. Of our three models the one explaining bed days use was most affected by the hospital provider variables, suggesting that that the effects at the individual hospital level on admissions and death in hospital are less significant than in total bed days. An implication of this is that hospitals seeking to improve care of the elderly near the end of their lives might be advised to focus on ensuring appropriate stay lengths.
Limitations
This study had some important limitations, the first being that the analyses looked only at resource use and did not compare the experiences of patients or carers. There were other variables that are potentially important predictors that we could not include—for example, living arrangements and strength of family/carer support. Our categorisation of diagnostic group makes assumptions about the accuracy of and consistency of coding which in some cases may be imperfect. Similarly we were unable to capture information about the level of community-based services for end of life care. Our analyses exclude a minority of people who had no prior recorded hospital use—though we suspect that differential findings in this group would not be sufficiently large to alter our conclusions.
The analysis of the models’ explanatory power also leads us to note that there was a significant amount of variation between patients that we could not explain. Overall r2 of the order of 0.2 is fairly typical performance for models on this scale and for models that seek to explain differences in resource use or future hospital admission24 ,25—an indication of how use of health services does include high levels of uncertainty.
Implications
This analysis highlights that hospital utilisation at the end of life is significant and that comparative analyses need to take account of factors that are beyond the control of local health systems—for example, decedents’ prior health status and ultimate cause of death. The models we developed can be used to adjust for these variables when estimating expected levels of resource use for making comparisons of specific organisations or areas. However, we do note that though we did detect differences associated with provider hospitals these were greatest for bed day use, and less important in relation to total admissions or whether a person died in hospital.
Hospital-specific differences raise important concerns that patient preferences about risk/benefits, aggressiveness of treatment and the course of care in some cases may not be taken fully into account (with provider practice style having undue influence on care decisions). They also suggest that cost savings might be feasible if high-rate areas can adopt more conservative utilisation patterns. This analysis suggests that variability in bed day utilisation may be more tractable than differences in admissions or even deaths in hospital. However, designing particular intervention strategies will require further analysis to determine the extent to which greater hospital use is attributable to either a lack of alternatives to hospital care, or to differences in local clinical practice style. If the latter then we may need to consider how patient/family preferences about the course of care are more effectively incorporated into the treatment decision-making process.
The extent of variation in hospital use at the end of life in England that we have documented is relatively modest, at least compared to the USA experience.26 However, these findings raise important issues for policymakers, and suggest the need for further study to determine whether action is required to ensure that the care received by patients is concordant with patient and family preferences about benefits, risks, and setting of care.
References
Footnotes
Contributors The preparation of data sets and input variables were undertaken by TG, RS and JB and RS did the central modelling and analysis with advice from Cono Ariti. MB drafted the paper and contributed to the analysis and interpretation of the results. All authors contributed to the writing of the paper.
Funding This research was funded by the Nuffield Trust arising from an analysis of resource allocation funded by the Department of Health. The study sponsor was the Chairman of the Nuffield Trust.
Competing interests None declared.
Ethics approval This study only involved the analysis of pseudonymous secondary data. Since there were no identifiable human subjects, ethics approval was not required for this research and informed consent was not sought.
Provenance and peer review Not commissioned; externally peer reviewed.
Data sharing statement The underlying episode level data from this study were originally supplied by the Health and Social Care Information Centre. As part of our conditions of use we undertook not to share the detailed person level data we held. Hospital Episodes Statistics data are copyright 2015, re-used with permission of The Health and Social Care Information Centre. All rights reserved.
↵i Long terms groups limited to: sickle cell anaemia, diabetes, hypertension, congestive heart failure, chronic obstructive pulmonary disease, ischaemic heart disease, asthma, connective tissue disease/rheumatoid arthritis, renal diseases, cardiovascular disease, angina.