Article Text

Abstract
End-of-life caring is often associated with reduced social networks for both the dying person and for the carer. However, those adopting a community participation and development approach, see the potential for the expansion and strengthening of networks. This paper uses Knox, Savage and Harvey's definitions of three generations social network analysis to analyse the caring networks of people with a terminal illness who are being cared for at home and identifies changes in these caring networks that occurred over the period of caring. Participatory network mapping of initial and current networks was used in nine focus groups. The analysis used key concepts from social network analysis (size, density, transitivity, betweenness and local clustering) together with qualitative analyses of the group's reflections on the maps. The results showed an increase in the size of the networks and that ties between the original members of the network strengthened. The qualitative data revealed the importance between core and peripheral network members and the diverse contributions of the network members. The research supports the value of third generation social network analysis and the potential for end-of-life caring to build social capital.
- Terminal Care
- Methodological Research
- Home Care
- Social Care
- Supportive Care
This is an Open Access article distributed in accordance with the Creative Commons Attribution Non Commercial (CC BY-NC 3.0) license, which permits others to distribute, remix, adapt, build upon this work non-commercially, and license their derivative works on different terms, provided the original work is properly cited and the use is non-commercial. See: http://creativecommons.org/licenses/by-nc/3.0/
Statistics from Altmetric.com
Introduction
Since Kellehear1 ,2 there has been a growing interest in community participation and development approaches to end-of-life (EOL) care. They are defined as any set of initiatives that develop the social resources of the community to enhance quality of life at EOL. One of the goals of the community development approach is to help individuals and communities to develop sustainable ways to care for their dying by building social capital. Terms such as community and social capital, however, are open to criticism for being vague, having undefined boundaries and multiple meanings. It is often very unclear who constitutes a particular community,3 when in urban areas, a person's friends and family maybe dispersed across the city and further afield. One way to overcome the criticisms is to focus on specific social networks.
The dominant form of social network analysis (SNA) is not a theory or group of theories,4 rather it is a series of mathematical techniques that analyse the patterns of connections, or ties, among individuals in the network. However, by comparing the theoretical assumptions behind the dominant sociological tradition to those of the anthropological tradition and recent sociological studies of social movements, Knox et al5 have identified three generations of social network theory. The first generation called ‘enriched individualism’ is typified by Granovetter's6 work. It provides a critique of the rational individual actor by pointing out that actors are embedded in networks of relationships and ties. The second generation is structuralist in that it examines the characteristics of the whole network and the dynamics and properties of differing types of network structure, for example, Robbins et al.7 The third generation draws on the theoretical work of Mische and White8 and seeks a fuller cultural and discursive understanding of social networks; thus they emphasise qualitative description of the nature of relationships, how they are maintained and their role in wider society, for example, studies of social movements.9–11 A key attribute of this approach is its focus on networks as changing and dynamic social constructions.9 From this perspective, it is not appropriate to predefine the boundaries of a network: the network must always be something constructed by and recognised by the members.
Third-generation social network studies overcome some of the criticisms of more technical approaches. First they place the study of social networks within a theoretical frame such as cultural theory, social movement theory or other constructivist approaches. Second, they do not try to arbitrarily define boundaries to networks. Third, by studying the nature of social actors and their ties they can meaningfully study the complexity and ambivalence of social relationships12 and attributes of actors.13 In the context of community development, third generation approaches can assess not only whether networks are growing but also whether community capacity is being developed in the process. Further, a third generation approach does not preclude the use of first and second generation techniques; rather it locates those techniques within a richer sociocultural paradigm.
The present research
The research describes the caring networks of people with a terminal illness who are being cared for at home and identifies changes in these caring networks that occurred over the period of caring. To trigger discussion, a participatory network mapping technique14 was used whereby the members draw network maps in a focus group and then discuss their observations. Out of such discussion comes the socially constructed understanding of the network. In addition, Generation 2 SNA was used to identify characteristics of the whole network and compare those characteristics before and after caring. Generation 1 SNA was used to look at the particular position of the principal carer and his or her support.
Research questions
-
How can community development through EOL caring (if any) be demonstrated?
-
Can SNA (Generations 1 and 2) be usefully embedded in a social constructivist paradigm (Generation 3) for social networking?
-
What insights into caring networks can be obtained to inform carers and palliative care service providers?
Method
Network Mapping Approach
The map making was a collective exercise intentionally designed to be different from the individual questionnaire procedure usually employed by network analysts15 (p43). The advantages of the group approach are that (1) the participants see the results and can give interpretive feedback, which becomes qualitative data and (2) people are able to remind each other of relationships and timelines in situ.
Participants
Nine focus groups of 3–17 participants (n=77) were formed from the caring networks of 8 women and 1 man who were either currently caring or had cared in the past 3 years for someone who was dying from cancer or motor neurone disease. Carers were recruited from suburban and rural areas through letters distributed by a carer support organisation and newspaper articles. The primary carers then identified the caring network invitees for the focus group.
Procedure
Using a large piece of butcher's paper, participants wrote their names and indicated the strength of their relationship to other people in the network using coloured pens (Yellow—weak; Blue—medium; red—strong) with arrows to show the direction of the relationship.
Two network maps were drawn—Time 1: the beginning of the caring journey and Time 2: the present time. The participants then discussed the maps and the changes they observed. Discussions, which lasted from a half to 1 h, were audiotaped and fully transcribed.
Ethics
Approval was obtained from the University of Western Sydney Human Research Ethics Committee (No. H6772).
Quantitative analysis
The network maps were transcribed into an adjacency matrix. NetDraw 2.117 within UCInet16 was used to turn the network adjacency matrices into computerised network maps with the thickness of lines indicating the strength of the ties. UCInet was used to measure size, density, transitivity, principal carer's betweenness and local clustering. The following definitions were used:
-
Size is the number of individuals in the networks.
-
Density is the number of ties divided by the number of possible ties. An increase in density indicates people are developing more connections and stronger relationships. In this study, the density takes into account the strength of the ties, which ranged from 0–3; thus, density can range from 0–3
-
Transitivity refers to the balance and reciprocity in the relationship among three individuals. High transitivity indicates that people are connecting with each other in egalitarian and cooperative ways.
-
The principal carer's betweenness value indicates the degree to which the carer acts as a bridge between two other individuals. A decrease in the betweenness or bridging function of the main carer indicates that she, or he, no longer needs to be the sole coordinator of the caring.
-
The principal carer's clustering coefficient is a measure of cohesion. The clustering coefficient of the principal carer is the density of the carer's close connections, that is, all the other individuals that are directly connected to the carer. An increase in the main carer's clustering may well indicate that the carer is gaining a stronger inner circle of support.
Analysis
The first level of analysis took place in the focus groups in order to understand the important aspects for participants, in terms of caring and the development of networks. The second level of analysis was a qualitative analysis of the discussions and the quantitative analysis of the network mapping exercise. The third level of analysis examined if, and how, the quantitative analysis illuminated further understandings of the caring networks. Five repeated measures t tests tested the hypotheses that each of the five network measures would change significantly from T1 to T2. These analyses were repeated for four measures with size kept constant by using the T2 ‘reduced network’ consisting of only those people who were identified at T1.
(Note pseudonyms are used in the maps)
We recognise that three important limitations of the study are (1) the possibility of a social desirability effect, which would inflate ties strength at both times, but not affect the change over time, (2) the reliance on memory for the T1 maps, which might exclude some weak ties; however, having the group discussion did stimulate memories of that time and (3) the network ties of people who were not present are underestimated.
Results
For an isolated carer with no support, all the statistics are zero; however, due to the nature of the study, there were no examples of such isolated carers. A minimal network is where the carer has access to a small number of helpers or services with whom she/he has weak ties. If the helpers do not know each other, then the visual representation of the network is a star of thin lines with the carer at the centre. The network has small size and low density but the carer has a high betweenness score because they are the only bridge and must coordinate all help. There are few or no triangles because the helpers do not communicate with each other so there is low transitivity. As the network increases in size, the number of points of the star increases. Stronger relationships are presented by thicker lines. As the density increases, the number of triangles and thickness of the lines increases and larger networks with high density have an almost circular shape.
Increases in network size
The sizes of the network increased from T1 to T2 for eight of the nine networks, which was a significant change (t (8)=2.81, p<0.05). One example is the network of Jane who had cared for her husband Steven who had died of a brain tumour 2 years prior. She had support from her church, her friends and her Home Hospice mentor. She also described an outer network of supporters who were an essential in her ability to care because they supported her parenting with transport and after-school activities and provided practical support around the house. At T1, her network consisted of five members. The helpers who knew each other, and Jane appeared to be marginal to the network (figure 1). The network had a density of 1.5 and Jane was the only person with a high betweenness value (3.0 for Jane; 0.0 for the others) since Jane was the only person who acted as a bridge. Eighty per cent of all the potentially transitive triads were transitive. This large number can be attributed to the small size of the network. Three of the five members are close and only Anne is not involved in a transitive triad.

Jane's network at Time 1.
By T2 Jane's network has 17 members and has a box-shape in the middle and a star around the outside (figure 2). Although Jane was benefitting from her wider network of supporters and 4 strong relationships rather than 1, she needed to increase her bridging to connect with the new people in the network so her betweenness score increased from 3 to 12. At T2, Jane is not the only person bridging. Pauline's betweenness score increased from 0 to 18 because she is liaising with other newcomers. Because the newcomers are not so well-connected in the network, the density of the network decreases from 1.5 to 0.34. The proportion of transitive triads decreased from 80% to 60% and local clustering for the main carer decreased from 1.50 to 0.76.

Jane's network at Time 2.
Increase in Density
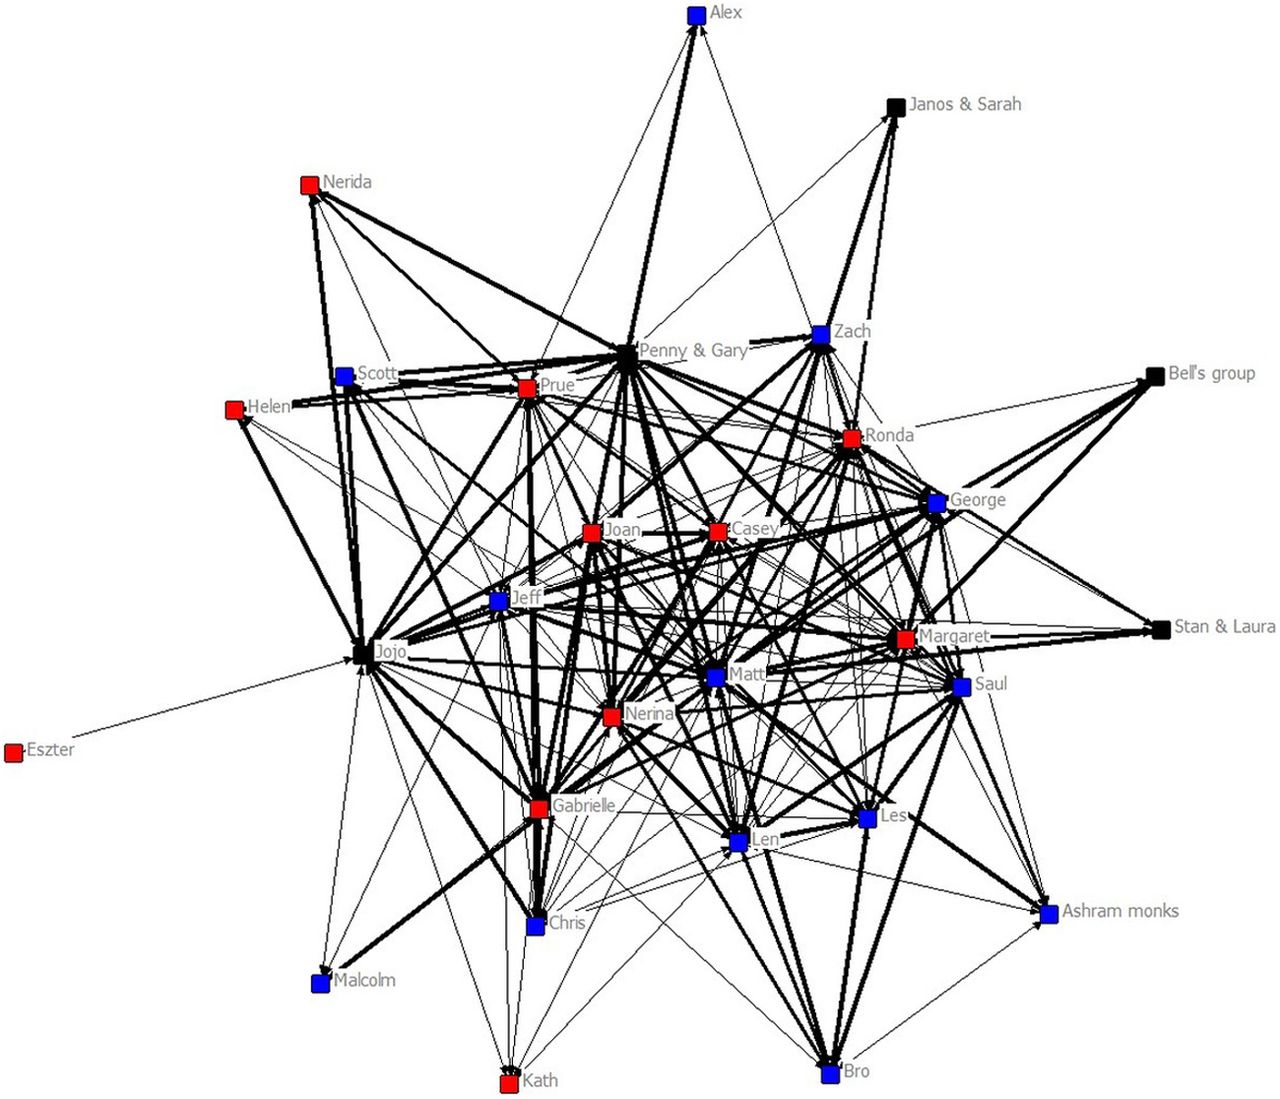
Margaret and George had cared for three years for their young adult son Matt who had Motor Neurone Disease. Matt's case is unusual because he coordinated the 38 hours per week of professional support and the informal support and he was present at the focus group. The informal network provided meals, company, adjustments to the home and respite for Matt's parents. Also Margaret had a Home Hospice mentor.
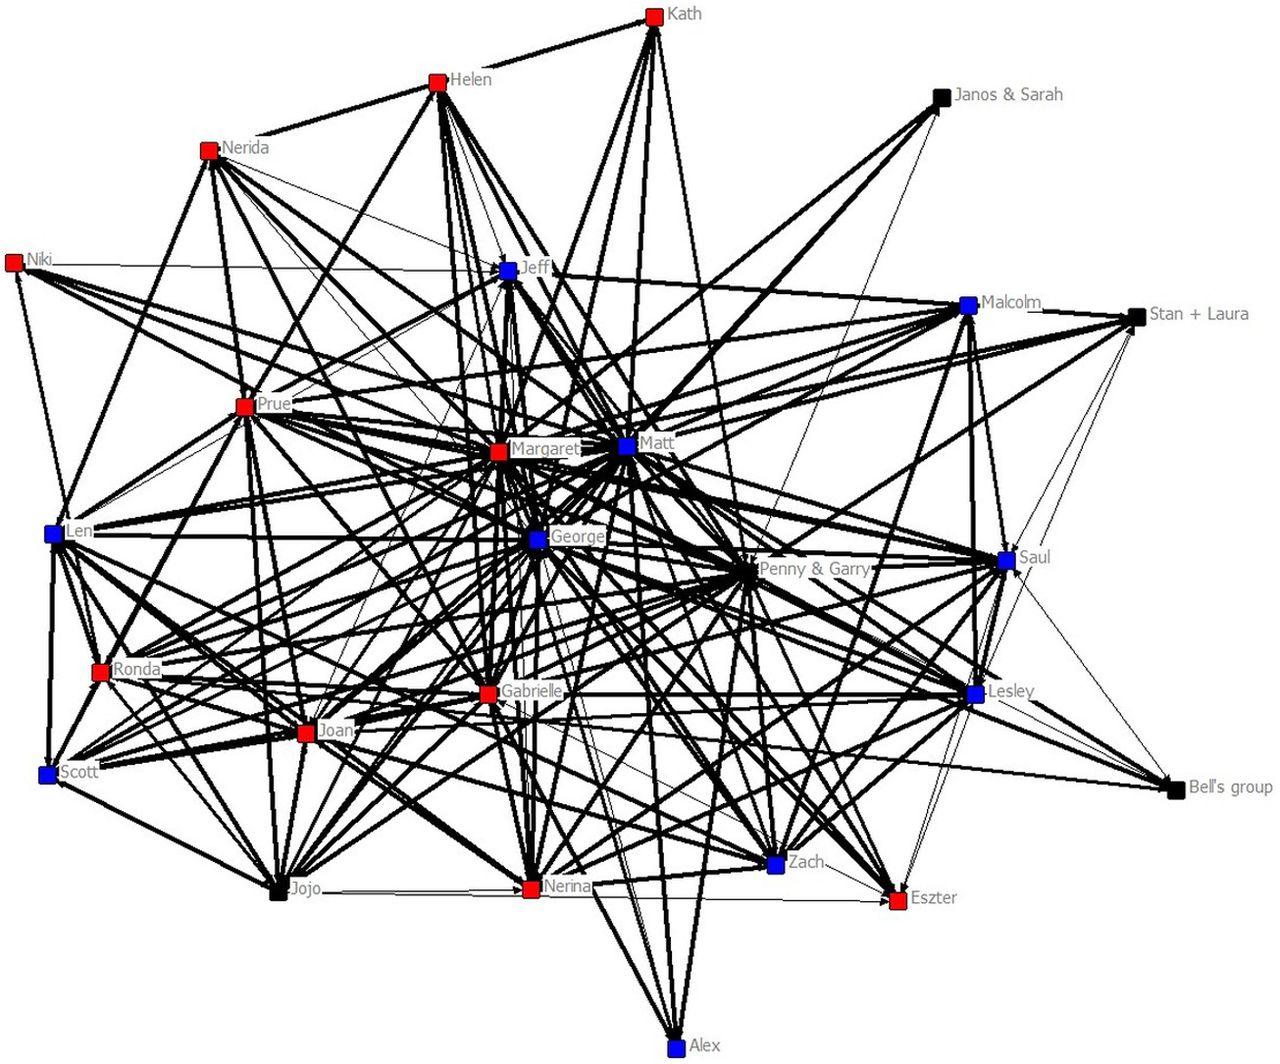
Matt's network was the only one that increased in density (from T1 0.71 to T2 1.25). Matt and his parents sought assistance from a meditation community and many helpers were already assisting at T1. In Matt's case, network size decreased slightly from 29 members at T1 to 26 members at T2. The high transitivity of 63.2% is visible in the network graph (figure 3), which takes the shape of a large box with some star-like points at T1 and was almost circular at T2 (figure 4). Here, 65% of the potentially transitive triads are transitive at T1 and 60.2% at T2, indicating that the network is very well interconnected, which takes a considerable amount of workload from Matt's parents.

Matt's network at Time 1.

Matt's network at Time 2.
At T1, Matt had a very high betweenness value of 56.5. At T2, his betweenness had decreased to 34.7. In contrast, his parents had much lower values of 11.1 for his father and 9.4 for his mother. This shows that initially Matt's parents were not highly involved in the community and all the helpers were connected to Matt directly. Over time his mother and father became more involved in the network and their betweenness values increased to 33.4 for Matt's father and to 32.6 for his mother. Matt's clustering coefficient also increased over time from 0.83 to 1.16, which reflects the increased cohesion of the network.
Overall pattern
The pattern of statistics for Jane appeared in 8 of the 9 networks. Increase in size was always associated with decreased density, transitivity and local clustering. For the five measures, the only changes to reach significance were the increase in size (t(8)=2.81, p<0.05) and decrease in the transitivity (t(8)=4.40, p<0.01) as, over time, more people joined the support networks, but were only connected to the main carer or a few individuals. This process creates more potentially transitive triads, which lower the percentage of the actually transitive triads.
Because of the inverse relationship between size and density (r(8)=−0.77), the T1 and T2 networks were compared with the size being kept constant by removing the newcomers (called the reduced network). The four reanalyses did reveal increases in the density for all the focus groups and decreases in betweenness for the principal carer for 5 of the 9 networks (in another network the main carer's betweenness was already very low); however, these effects did not reach significance.
Overall, it appears that caring networks in this study enlarged and strengthened over the period from T1 to T2 but a larger sample is needed to properly test the relationships.
4. Qualitative analysis
The discussions fleshed out the nature of the ties, and details about the help provided are published elsewhere.17 People were included in the networks when they just sent encouragement through emails and phone calls, which were valued by the principal carer but could create extra work. In Lester's very private family where he and one daughter did all the hands-on caring, the other people identified in the network mainly provided moral support. In contrast, in Matt's case, the network was involved in most aspects of Matt's care including some who helped shower him. Matt's mother commented that she had cared for her parents and experienced burn-out but this time she was not worried about that.
Comparing the T1 and T2 maps in all but Matt's group, it was immediately clear to the participants that all the networks increased in size. People spoke about increased number of friends and their new communities, highlighting changes in individual and collective relationships: These sorts of things do broaden your community and your support (FG 1).
People also commented on changes in the quality and nature of the relationships: at T2 there were more stronger connections (FG 1) or more intimate relationships (FG 3) and that the intensity of relationships has changed (FG 1) evidenced by them seeing each other more often than they did and talking about more personal issues than before caring; it just looks like everyone loved me more (FG 9). Further, a number of focus groups distinguished between the core and outer networks in their discussions. It was the core for which there was the major strengthening of relationships.
Although it was not a strong theme, there were some stories of loss of relationships A few people spoke of tensions between family members regarding the type and place of care provided:
It wasn't always easy though. I experienced with you some very negative stuff from other family members (FG 5).
Some tensions were just part of the everyday negotiations involved in caring. Others experienced serious changes such as the end of friendships or the loss of employment.
Discussion
There is a visual power of the network maps as they reveal the increase in size and complexity of relationships over time. The change was supported by the qualitative data, which revealed the positive nature of relationships. In these results, we are not disputing the dominant findings of the literature on caring, that caring often leads to social isolation; rather we are providing evidence that it does not have to be the case, and thus, supporting Kellehear's1 argument for the possibility of community development at EOL.
In social network analysis, at its simplest, there are two ways that a network can grow; it can increase in size or it can increase in the number and strength of ties within the network (density). The quantitative results revealed a significant increase in size but no change in the density. Indeed they revealed the need to recognise the tension between the two because increasing the size of a network is likely to decrease its density as there are more potential relationships and usually these take time to develop. The density would have decreased significantly because of the increase in size had it not been balanced by an increase in the strength of many ties in the networks.
The focus group discussion revealed that the increase in size was readily apparent to the participants but the decrease in density was not. The participants talked about the increasing strength and warmth of relationships and indeed many relationships did increase in strength but not enough to statistically increase the density. A potential explanation that emerged from the discussion was the difference between the core and peripheral parts of the network with density increasing at the core while the periphery has low density. This explanation was supported by the statistics when they were recalculated without the newcomers. There was an increase in density when size was kept constant but it did not reach significance due to the small sample size.
Managing a network can be an additional demand on carers who are already overworked; so it was good to see a trend for the principal carers' bridging to decrease over time especially in the reduced network. It was also good to see that other people increased their bridging as they shared the coordination of the bevy of helpers. Another useful statistic for describing the carer's role was the local clustering coefficient, which measures the extent to which the carer has a strong core network. Again this statistic was increasing in the reduced network but did not reach significance. Another positive is an increase in transitivity of the core network as people connect with each other, hopefully in egalitarian and cooperative ways.
Some of the benefits of a third-generation method were that it clarified the nature of the ties and participants could comment on the broken relationships that would not appear in the network maps. The other benefit was the opportunity for the participants to reflect on the maps both for the insights for the research and for their personal validation as they recognised the size, complexity and importance of the network they had created.
Using a community development model to encourage the growth of caring networks in EOL care can benefit carers and spread the word that dying is part of living, not the special domain of the medical profession. Carers need to know that there is a risk of burn-out but it can be avoided as there is often both formal and informal help available. Indeed if caregivers can see that they are contributing to their community by providing an opportunity for meaningful connection then they may be less reticent to ask for help. Formal service providers may need to give increased recognition to the informal assistance required for a person to die with dignity and comfort and could assist the primary carer to mobilise an informal network or identify other organisations that can assist.
With a study of only nine focus groups, this research cannot provide a full description of the nature and structure of caring networks. Rather it has shown the possibility of using a third-generation social network approach to demonstrate community development through EOL caring. Further by demonstrating the value of integrating the three generations of social network analysis, it has provided some insights for carers and formal service providers into the value of informal caring networks.
Acknowledgments
We would like to acknowledge the support of the HOME Hospice, now Lifecircle.
Footnotes
-
Contributors RL reviewed the literature on network analysis, designed the network mapping method, conducted the network analysis, reported the network method and results, and wrote the discussion. KN refined the method for practical application and made a major contribution to the writing of the introduction. DH lead the qualitative analysis and writing of that section as well as contributing to the refinement and editing of the whole paper. All three authors were involved in data collection. RL is guarantor for this research.
-
Funding This project was funded by the Cancer Council of NSW and the University of Western Sydney.
-
Competing interests None.
-
Ethics approval University of Western Sydney Human Ethics Research Committee.
-
Provenance and peer review Not commissioned; externally peer reviewed.